Initial Experiments with Datalogging Software
This software was designed by Rod Shepherd and Rod and Emma O'Brien have
been working with schools to get the datalogging up and running.
Pupils used the Data Logging Software and the RCX to take Light and Temperature readings during the night at the school. The RCX was placed inside the window and the light and temperature sensors were placed outside the window. Readings were taken every ten minutes throughout the night.
Rod Shepherd, who designed the software took similar readings in Dublin city centre on the same night.
Dónal, a pupil of Newcastle N.S., one of our partner schools in the project, took similar readings in the suburbs of Dublin. There was a problem with this RCX on that night and so the readings we have for the suburbs relate to a different night.
Datalogger Interface
 |
|
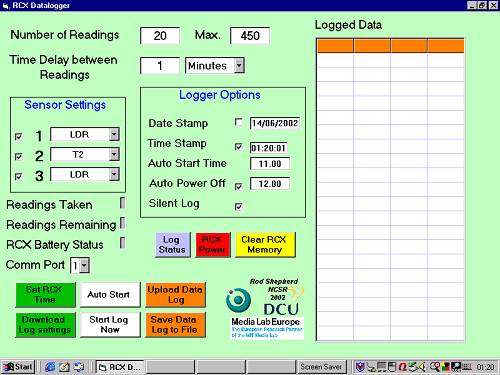
This is what the Datalogger interface looks like.
The logged data columns will contain the data when it is uploaded from
the RCX. It can then be saved to a text file and the text file can be
opened in Excel to graph the data.
|
Satellite Weather Photographs
|
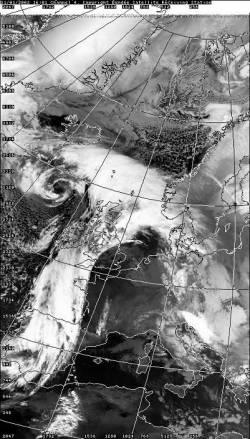
January 21st, 2002 at 16.00 hours.
|
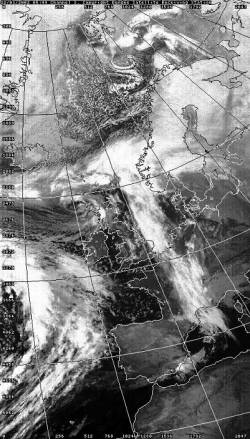
January 22nd, 06.00 hours.
|
 |
 |
|
These satellite weather photographs are available from the Dundee University website. |
|
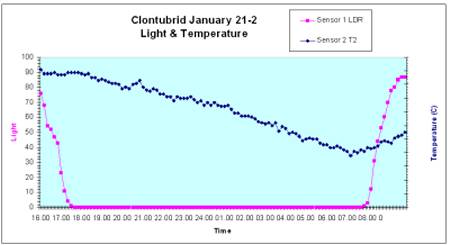
Light & Temperature Readings, Clontubrid, January 21st-22nd.
Readings by Clontubrid Pupils
 |
|
This is the graph of the Light and Temperature readings
which pupils collected for Clontubrid from 4.00 p.m. on January 21st to
9.00 a.m. on January 22nd. The readings were collected using light/temperature
sensors and the RCX brick. They were then uploaded to the computer using
the Infra Red tower and saved as a text file. The text file was then imported
into Excel and the readings graphed.
|
The readings above were taken at ten-minute inytervals. The time just before sunrise was the coldest and the temperature was falling from the previous evening until that time. Then the temperature slowly began to rise. These observations surprised the children. It was not the pattern that they expected.
The light levels fell quickly to a zero reading. The light levels stayed at zero until shortly before sunrise and then rose quickly. The rapid fall and rise in light levels compared to the slower fall and rise of temperature levels was also a surprise to the pupils (and teachers!!)
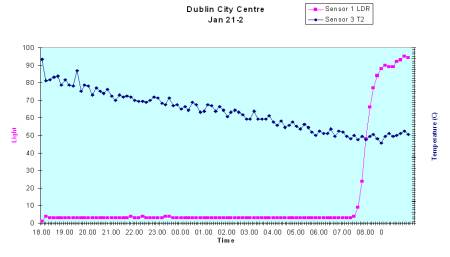
Light & Temperature Readings, Dublin, January 21st-22nd
Readings by Roderick Shepherd
 |
|
These are the readings which Rod Shepherd got in
the centre of Dublin on the same night. The readings did not begin until
6.00 p.m. in the evening.
|
Pupils noticed that the pattern for the fall in temperature was different and that the temperature was higher than in Clontubrid.
They also noticed that the light readings never fell to zero in the city and that the morning light came a little earlier (farther east).
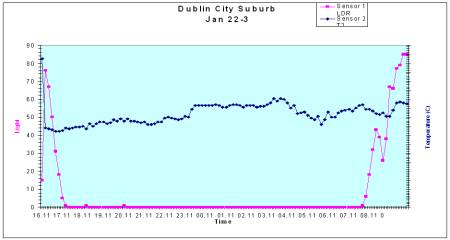
Light & Temperature Readings, Dublin Suburb, January 22nd-23rd
Readings by Donal Murphy
 |
|
These readings were taken by Dónal in the
suburbs of Dublin. Due to a problem with the RCX these readings are for
the following night so it was difficult to compare the figures, especially
the temperature figures. The light readings are similar to those at Clontubrid.
|
Observations of Pupils
Pupils discussed the readings from the three different locations and compared the figures. They had also been asked to predict what the readings might show before they were taken. The following is a small selection the observations of pupils which arose during the discussions:
Clontubrid was darker. Why?
It was colder in Clontubrid. Why?
What part of the night did you think would be coldest?
Why do you think it was coldest about 7.00a.m.?
Why did the temperature not rise as quickly in the morning as the light did?
Why did the temperature not rise quickly in the morning as the light did?