Chapter
4
System
Design
Introduction
This
chapter outlines the design of the system to be developed. It specifies the
entire operation of the system, but will not cover any details of how the system
will be implemented. Some of the finer details of how specific parts of the
system will work have been omitted in order to make the design easier to
understand.
NOTE – A certain amount of
knowledge about the fundamentals of object orientation is required to understand
the design given here. No knowledge of any specific programming language is
necessary; this design could be implemented in any suitable object oriented
programming language (as long as it supports
concurrency).
The chapter is divided into
eight sections:
4.1 Design Method
Used
4.2 System
Context
4.3 Use
Cases
4.4 Sequence
Diagrams
4.5 Objects and
Classes
4.6 State
Charts
4.7 GUI
Design
4.8 Parser Design
4.1. Design Method
Used
UML has been used as the modelling
language in the design of this project. It is an object-oriented approach to
system development, and allows easy transition between the various stages of the
development lifecycle. It is also a fairly modern language, and is quickly
becoming the standard for object-oriented
development.
UML is a graphical language, and
consists of a number of diagrams that specify a systems operation. The diagrams
used are as follows:
This shows how the system
interacts with entities that are external to the system itself (these are called
actors). This also includes an external event list that defines the messages
that are passed between the actors and the system itself.
This shows the main operations
that are performed by the system, and the actors that contribute to each
operation. This provides a high level overview of what the system must do. Each
use case represents an operation, and each is also described
textually.
These diagrams show the
ordering in time of the messages that are passed between the actors and the
system under various scenarios.
This diagram shows the objects
within the system and the relationships between them. It also shows the numbers
of instances of each object.
This diagram shows the classes
within the system from which the objects are created. It also shows the
relationships between these classes.
These are used to define at a
much lower level the operation of the system. They are a hierarchical set of
diagrams that model the behaviour of the
system.
The design of the user interface, and
the design of the “parser” that converts the web page into plain
text have been described separately from the rest of the system. This is because
their complexity requires a more in-depth explanation than that given for the
rest of the system.
4.2. System
Context
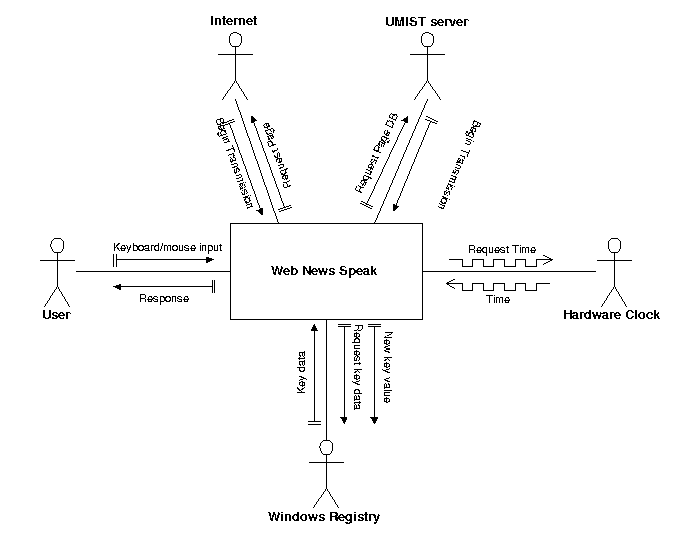
The system context diagram shows
the actors (external entities) that the system interacts with during its
execution as stick men. Actors are defined as things that exist separately from
the system being developed. Entities created by the system (e.g. the compiled
newspaper, the log file) do not count as actors. It is also important not to
confuse actors with objects that exist within the system itself – i.e.
instances of classes within the program code. The system context diagram is
shown in figure 4.2a.
 Figure
4.2a – System Context Diagram
As you can see from the diagram, there are five
actors that the system interacts with. The windows registry is only used for
changing autodial settings, so that the system can automatically dial the modem,
and so does not play a large roll in the system, but is included for
completeness. The arrows on the diagram show the messages sent between the
system and each of the external objects. These messages can also be interpreted
as events that impact the system in some way. A description of each of these
events, and how system responds to them is shown in figure
4.2b.
|
Event
|
System Response
|
Direction
Pattern
|
Arrival Pattern
|
Synchronisation
Pattern
|
|
User provides input
|
Move to selected menu or perform chosen
operation
|
In
|
Episodic
|
Synchronous
|
|
Response to user
|
Screen is updated to reflect changes caused by
user input
|
Out
|
Episodic
|
Synchronous
|
|
System requests time from hardware
clock
|
System halts until it receives the time from
the PC’s hardware clock
|
Out
|
Periodic
|
Synchronous
|
|
Time sent back to system
|
System receives the time, and takes appropriate
action if necessary
|
In
|
Periodic
|
Synchronous
|
|
System requests web page
|
System waits for a response from web server
until timeout delay has expired
|
Out
|
Episodic
|
Timed
|
|
Web server begins transmitting
page
|
System receives data from the server and saves
it to a temporary file
|
In
|
Episodic
|
Synchronous
|
|
System requests page database from UMIST
server
|
System waits for a response from UMIST server
until timeout delay has expired
|
Out
|
Episodic
|
Timed
|
|
UMIST server begins transmitting
database
|
System receives data from the UMIST server and
saves it to a file
|
In
|
Episodic
|
Synchronous
|
|
System requests registry key
data
|
System waits for a response from the windows
registry
|
Out
|
Episodic
|
Synchronous
|
|
Registry returns key data
|
System stores key data
|
In
|
Episodic
|
Synchronous
|
|
System sends a new key value to
registry
|
None
|
Out
|
Episodic
|
Asynchronous
|
Figure 4.2b – External Event
List
The direction of the message flow is also shown,
as well as arrival and synchronisation patterns (these are also shown by the
types of arrow in figure 4.2a). These give some idea of how frequently messages
will be sent and received. The external event list in UML can also be used to
provide ideal response times that the system should try to meet, but for this
application this is not
necessary.
4.3. Use
Cases
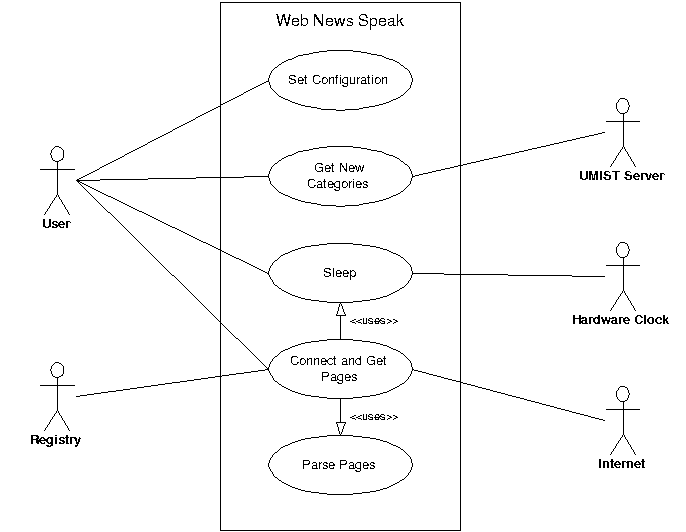
Use cases are a method that can be
used to identify and isolate the most important aspects of the systems operation
and use. Each use case represents an operation that the system performs. Use
case model allows a high-level view of the main operations performed by the
system, and is useful for verifying exactly what the main operations to be
performed actually are. The system is represented by a single rectangle, and
each use case is represented by ovals inside this
rectangle.
The use case model is shown in
figure 4.3a.
 Figure
4.3a – Use Case Model
The use cases themselves are defined in plain
English in figure 4.3b.
|
Use Cases
|
- Set Configuration
- Normal: When the user
chooses “Change Settings” from the menu a new window appears that
allows them to change various aspects of the systems
behaviour.
- Get New Categories
- Normal: When the user chooses to get new
categories the system attempts to connect to the UMIST server and retrieve the
page database. When complete, the user is informed of success.
- Exception: If no reply is received within the
timeout delay, the system retries the number of times specified in the settings
and if unsuccessful informs the user of an error.
- Sleep
- Normal: When the user chooses to put the system
in sleep mode it is minimised, and polls the hardware clock for the time every
five seconds.
- Exception: When the time received from the
hardware clock matches the download time specified in the settings the process
of downloading the pages begins.
- Connect and Get Pages
- Normal: When the user chooses to “Get News
Now” from the menu, or the system is sleeping and the chosen time is
reached, download begins. The sites containing all the selected pages are
connected to and the pages requested. After each page is received it is sent to
the parser to be parsed. After all pages are downloaded and parsed, the user is
informed that the process is complete.
- Exception: If no reply is received from a site
within the timeout delay, the system retries the number of times specified in
the settings. If unsuccessful it aborts – sending an error message to the
parser for insertion into the parsed page.
- Parse Pages
- Normal: When a page has been downloaded, the
parser converts the page into text and links it to the other
pages.
|
Figure 4.3b – Use Case
Descriptions
Each use case has a description of its normal
operation, and in some cases there is also a description of any exceptional
circumstances and the operations carried out in these circumstances. This helps
to clearly define the main operations, so that we can be sure they meet the
requirements. Another advantage of designing the operation of the system in this
way is that the use cases can be shown to potential users of the system to see
if it meets their expectations of how the system will work. In the case of this
project the application being produced is more of a feasibility study, so
showing the use cases to potential users is not really
necessary.
4.4. Sequence
Diagrams
UML sequence diagrams show the
ordering in time of the messages that are sent between actors and the system.
They show, for a number of different scenarios, the messages passed between the
system and actors and the order in which they are passed. Sequence diagrams can
include timings for real-time systems, but for this application this is not
necessary because there are no strict time
constraints.
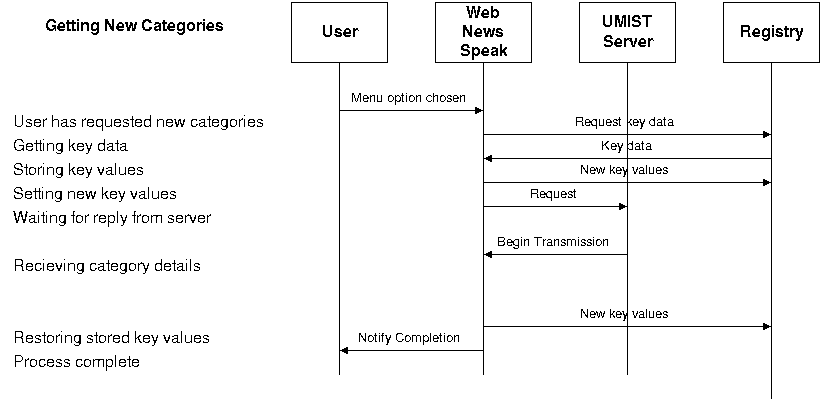
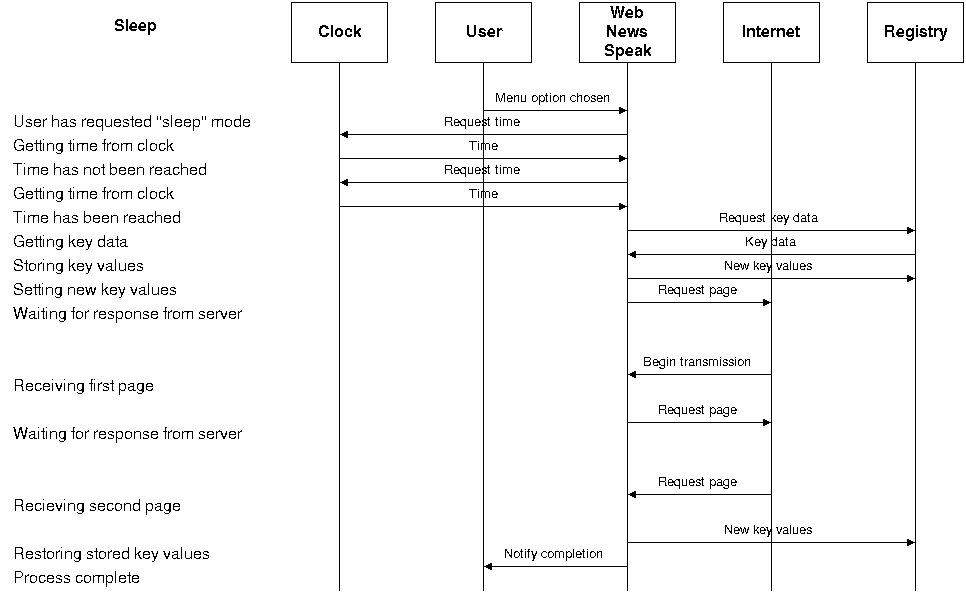
The sequence diagrams for two
scenarios are shown in figures 4.4a and 4.4b.
 Figure
4.4a – Sequence Diagram for getting new categories
The sequence diagram in figure 4.4a shows the
sequence of messages passed between the system (the “Web News Speak”
box) and the actors. The horizontal lines represent the messages, and the
vertical lines show the passage of time. The spacing of the horizontal lines is
important, as it gives some idea of when the system will have to wait for a
reply, and when a near instantaneous response can be expected. For example,
after the system sends a “request” message to the UMIST server,
there is likely to be a short delay before it begins transmission. This is shown
on the diagram by the vertical spacing of the two messages.
 Figure
4.4b – Sequence diagram for “sleep” mode
The sequence diagram shown in figure 4.4b shows
the sequence of messages passed once the user puts the system into
“sleep” mode. The system waits until the correct time before
downloading the news pages.
NOTE – In the
diagram, the system only had to poll the hardware clock twice before the desired
time was reached, in practice the system may have to poll the clock many more
times.
4.5. Objects and
Classes
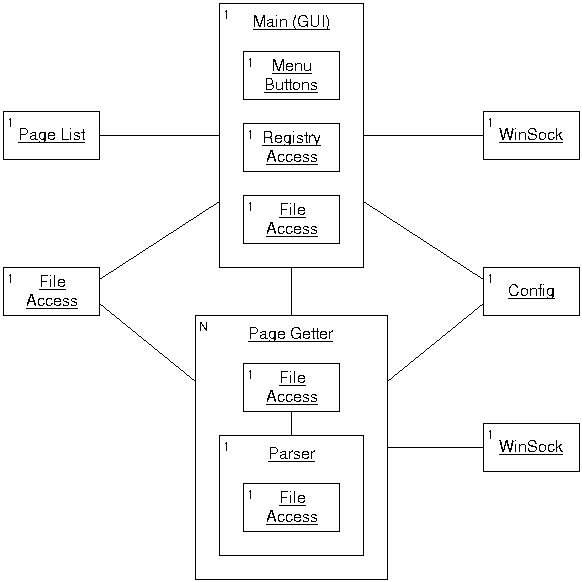
An object diagram shows the
internal objects within the system, and the relationships between them. The
object diagram for the system is shown in figure 4.5a. Each object within the
system is shown as a box, with the name of the object shown as underlined
text.
The purpose of each object within the
system is as follows:
- The “Main (GIU)” object is where execution
begins. It controls the user interface (the GUI), and is where most of the other
objects are created.
- The “Menu Buttons” object controls what
text is put onto the buttons on the menu. It is also in charge of making buttons
visible or invisible as appropriate. Whenever the user changes to a different
menu, this object changes the text of the buttons appropriately.
- The “Registry Access” object handles all
calls to read or write data to or from the windows registry.
- The “File Access” object handles all file
accesses. Whenever a file is created, written to, or read from, this object
handles all these operations. A separate instance of this object is used for
each file. This object also takes care of any mutual exclusion constraints
necessary for file access by multiple threads.
- The “Page List” object is a data structure
that maintains all the data about categories and pages read from the page
database.
- The “Config” object maintains all the users
settings. It contains all the methods for saving and loading the settings from
the ini file.
- The “WinSock” object handles the connection
to the Internet, and the downloading of information from remote
servers.
- The “Page Getter” object handles the
downloading of a chosen page and all it’s sub-pages. An instance of this
object is created concurrently for each site to be downloaded.
- The “Parser” object takes the downloaded
file and converts it to plain text for inclusion in the newspaper. One instance
of the parser is used for each page
downloaded.
The diagram shows
where there are multiple instances of certain objects by indicating how many
instances there are in the top left hand corner the object. So, for example,
there is an instance of the “File Access” object inside “Main
(GUI)” which represents the object dealing with the contents page of the
newspaper. There is another instance of this object that is shared between
“Main (GUI)” and “Page Getter” that represents the
object dealing with the log file. The other two instances are within “Page
Getter” – which may itself have many instances – and represent
the objects dealing with the downloaded page and the parsed
page.
 Figure
4.5a – Object Diagram
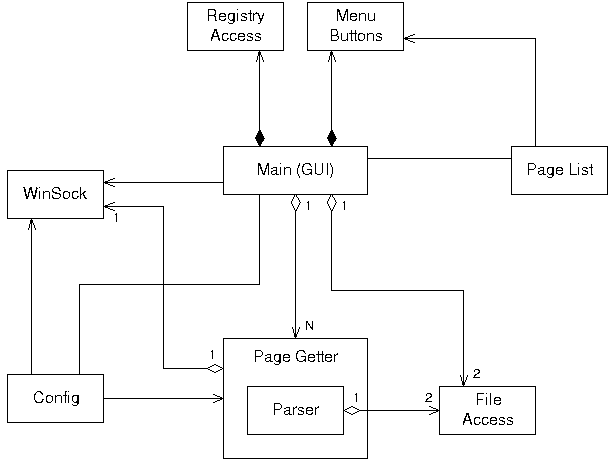
A class diagram shows the classes from which the
objects within the system are created, and the relationships between the
classes. The class diagram for the system is shown in figure 4.5b. The class
diagram helps to indicate the structure of the code to be developed, and is more
representative of how it can be implemented. In this diagram each class is shown
only once, but the aggregation shown indicates the number of classes that are
likely to be owned by another class. These indicate the classes that go to make
up another class. Aggregation is shown as a diamond at one end (the
“owner” end) of the arrow connecting classes. There are no inherited
classes in this system.
 Figure
4.5b – Class Diagram
4.6. State
Charts
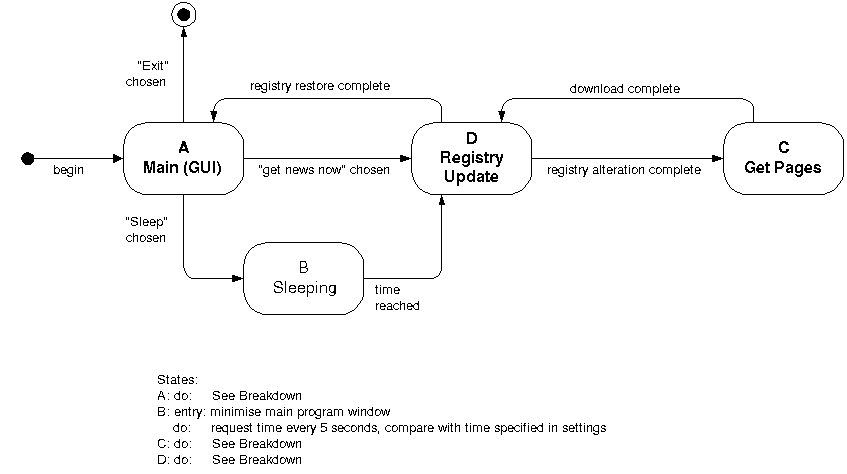
UML state charts are an extended
version of FSM (Finite State Machines) notation. They add modular, hierarchical
elements, to make the state charts easier to understand for complex systems, and
to prevent the state charts getting too
large.
The state charts for the system are
shown in figures 4.6a – 4.6f.
In these
diagrams, the states are shown as rounded rectangles, and the transitions are
shown as lines between the states. The event that triggers the transition is
shown next to each transition. Where text is enclosed in square brackets it is a
condition that must be satisfied for the transition to be activated. The lozenge
symbol is used to indicate that the transition could follow more than one path
depending on the conditions of the transitions. When a transition points to a
state which has sub-states within it, execution within the state begins at the
starting state indicated by a filled black circle. Where concurrency is shown in
a state chart, a dotted line is used to separate threads of control that should
run concurrently. A thread ends when the termination symbol is reached. The
termination symbol is a filled black circle surrounded by an unfilled
circle.
Descriptions of what the system is
doing while it is in each of the states, as well as any actions it performs on
entry or exit of a state are shown below each
diagram.
The state charts tie in loosely with the
classes defined in the class diagram (figure 4.5b), but are more concerned with
modelling the operation of the system as a whole independent of the classes that
will be used in implementation. A number of areas have been simplified to cut
down the number of diagrams, and make the system easier to understand. The
states within the parser have been left out because they would have been very
complex. The design of the parser has been covered in section 4.8 of this
report.
 Figure
4.6a – Top-level state chart
The state chart in figure 4.6a is the top-level
state chart, and it describes the operation of the whole system, but does not
provide much detail. It consists of four states, three of which are broken down
further in the following diagrams.
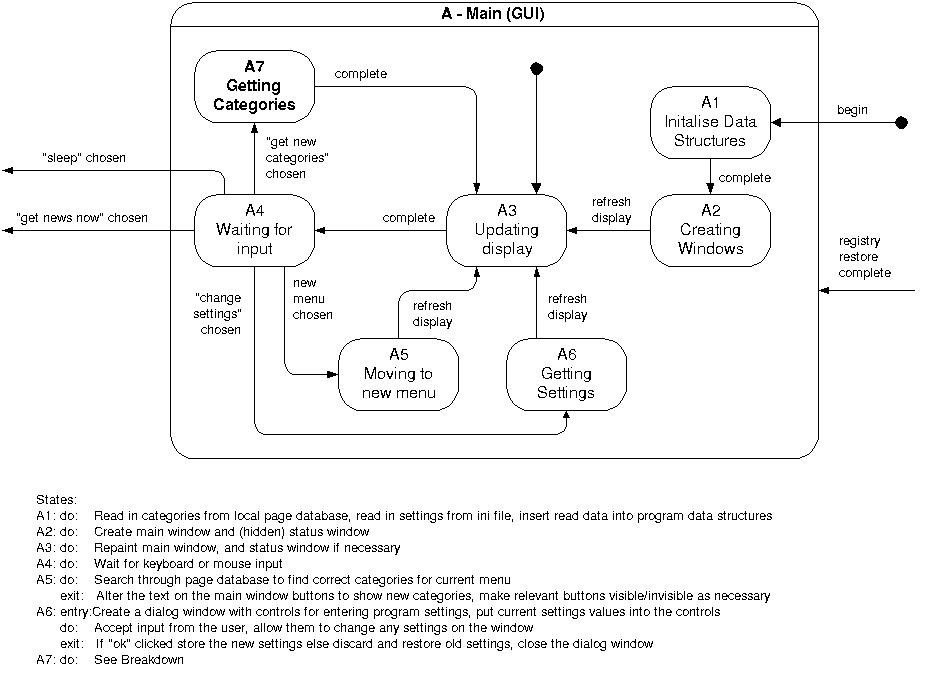
Figure
4.6b shows a breakdown of state A from figure 4.6a.
 Figure
4.6b – Breakdown of state A
Figure 4.6b defines the operation of the system
while it is in the “Main (GUI)” state. State A7 breaks down further
in figure 4.6
Figure 4.6c shows a breakdown of
state C from figure 4.6a.
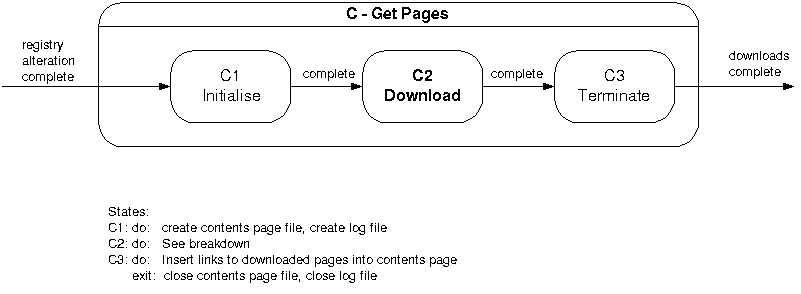 Figure
4.6c – Breakdown of state C
Figure 4.6c defines the operation of the system
while it is in the “Get Pages” state. State C2 breaks down further
in figure 4.6f.
Figure 4.6d shows a breakdown
of state D from figure 4.6a and 4.6e.
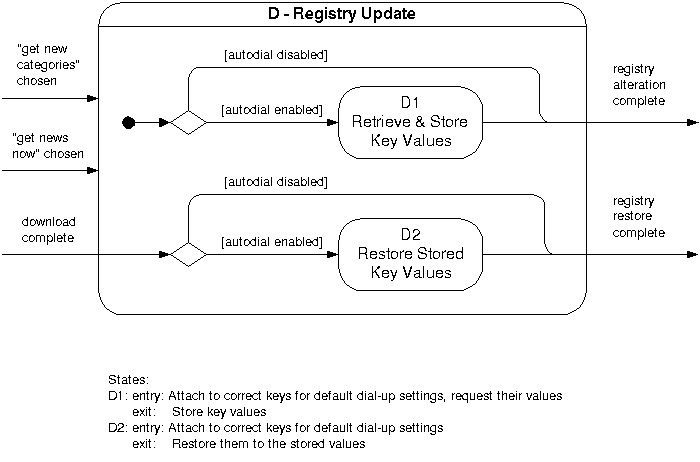 Figure
4.6d – Breakdown of state D
Figure 4.6d defines the operation of the system
while it is in the “Registry Update”
state.
Figure 4.6e shows a breakdown of state A7
from figure 4.6b.
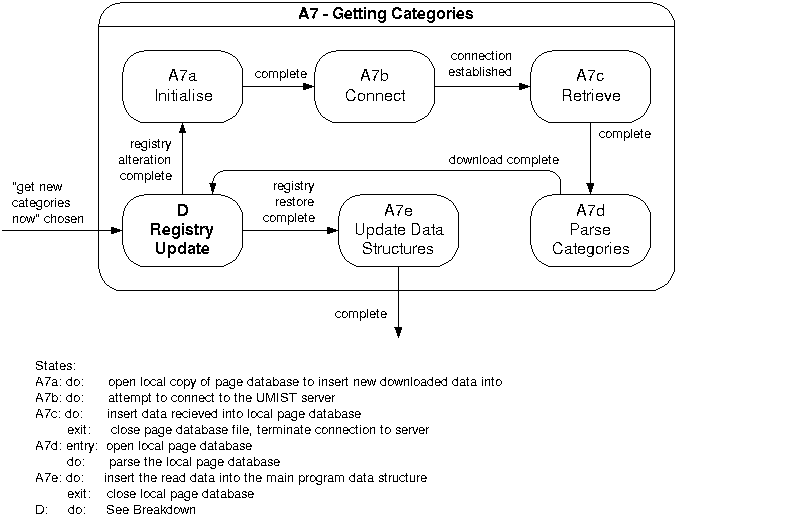 Figure
4.6e – Breakdown of state A7
Figure 4.6e defines the operation of the system
while it is in the “Getting Categories”
state.
Figure 4.6f shows a breakdown of state C2
from figure 4.6c.
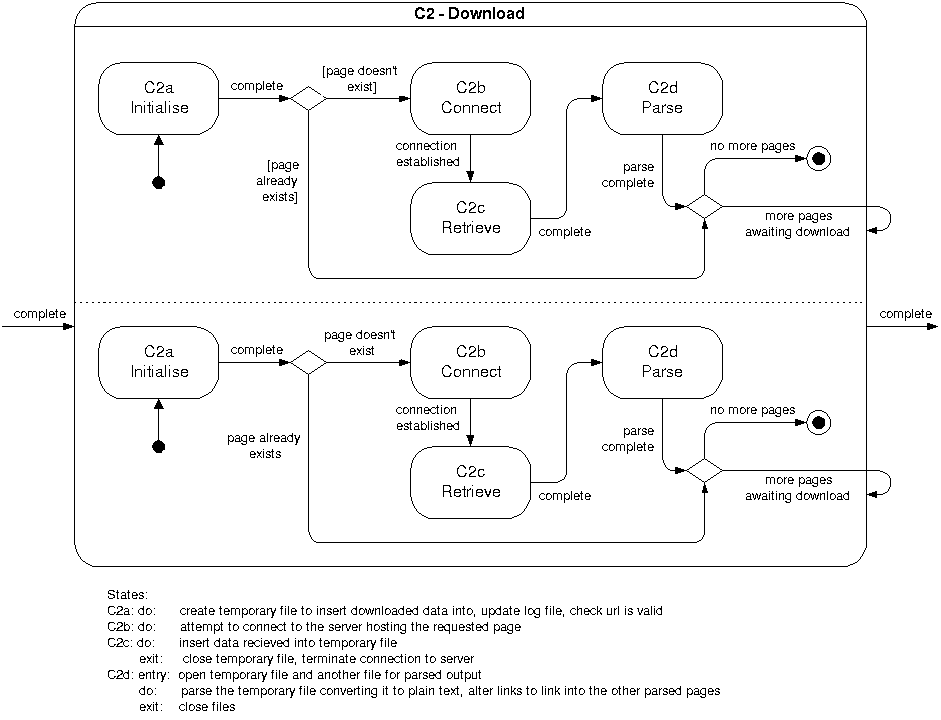 Figure
4.6f – Breakdown of state C2
Figure 4.6f defines the operation of the system
while it is in the “Download”
state.
4.7. GUI
Design
It was decided to make the user
interface as simple as possible. It uses a single window with 10 buttons on it.
When the user navigates through different menus to select their chosen
categories, the text on the buttons is changed rather than opening a new window
each time. This makes it easier to keep track of what is going on at all times
when using a screen reader.
When choosing
categories, the menus are arranged in a hierarchy, so at the top level are the
main subjects e.g. “Sport”, “News”, “TV and
Radio”, etc. and selecting any of these categories will take the user to
sub categories on that subject, so clicking on “Sport” for example
might give a new menu containing “Football”, “Rugby”,
“Motorsport”, “Cricket”,
etc.
Keyboard shortcuts were also used for
each of the ten buttons. These are the function keys F1-F9 and the escape key.
For consistency the tenth button (in the bottom right hand corner) always takes
you up to the next level up in the menu hierarchy, and at the top level it exits
the application. This tenth button is controlled using the escape key. The tab
and shift-tab keys can also be used to move between the buttons in order, as is
the convention in windows.
For entering
settings for the application, another window had to be used. This is limited to
one window, rather than having several windows, or a window with several panes
controlled using a tab strip. Again, this is in an attempt to keep the interface
as simple as possible to make it easier to
use.
Simplicity is important for usability,
especially when the system is being used through a screen
reader.
“Our life is frittered away
by detail. Simplicity, simplicity.”
-- Hendry David Thoreau –
Walden (1854)
Where I lived, and what I
lived for in Writings (1906 ed.) vol. 2, p. 1 [QUOTE]
It was decided that while the system is
downloading the pages for the newspaper, there should be a status window
visible, so that the user can tell that the system is actually doing something,
and can tell how the system is progressing. This also allows a way for the user
to cancel the download while it is in
progress.
There are some screen shots of the
user interface in Appendix A that show the layout of the buttons on the screen.
They also show the layout of the settings screen, and the status window that
appears during download.
4.8. Parser
Design
The Parser is the part of the
system that converts the downloaded web pages (HTML files) into plain text. This
is one of the most important and also most complex parts of the
system.
Graphical elements, and complex
formatting in web pages is produced using
“Tags”.
The policy decided upon
for handling such tags is shown in figure 4.8a
|
Policies for Handling HTML
Tags
|
|
Tag
|
Action Taken
|
|
& --- ;
|
Special characters will be replaced by a
textual equivalent, e.g. ©, represented by © will be replaced by
the word
“copyright”.
Unrecognised
special characters (if there are any), will be replaced by the symbol for the
character, e.g. ©.
|
|
Unrecognised Tag
|
Removed
|
|
IMG
|
Possibly replaced by the word
“image”
If available
“alt” text will be included instead
|
|
TABLE
|
Tables can be handled in three ways depending
on the page. They can be simply displayed as if they were normal text with no
extra formatting, they can be announced e.g. by inserting the text
“Table”, or they can be removed completely.
|
|
TR
|
Replaced by new-line character (unless the
table is being ignored)
|
|
TD
|
Replaced by a white space character (unless the
table is being ignored)
|
|
!--
|
Comments will be removed
|
|
SCRIPT
|
Scripts will be removed
|
|
STYLE
|
Style tags will be removed
|
|
A HREF
|
Links will be included. If the link is to be
followed then the link will be altered to point to the locally stored
page.
If not, the link text will either be
changed to just plain text, or be left as a link and prefixed by the word
“external: “ and will point to the original page on the
web
|
|
FRAMESET
|
As soon as the page is recognised as a frames
page, the following text will be
inserted:
“This page is a frames
page, the pages within the frames are listed below:”
|
|
FRAME
|
Frame pages should be avoided, the page within
a frame should be used
instead.
Downloading the pages within each
frame and inserting a link to each one could add some limited support for
frames.
|
|
NOFRAMES
|
The text within noframes tags will be included
prefixed by “The non-frames equivalent for this page
is:”
|
|
BR
|
This will be included
unaltered.
|
|
CAPTION
|
The caption text will be included prefixed by
“Table caption:”
|
|
TH
|
This will be treated the same as
TD
|
|
HR
|
This will be removed
|
|
TITLE
|
The document title will be put at the top of
the page prefixed by “Title:“
|
|
MAP
|
This will be replaced by the text “Image
Map”
|
|
AREA
|
Image map areas will be treated as normal
links, if an alt tag is used that will be included as the text of the link,
other wise the word “link” will be used.
|
Figure 4.8a – Policies for
Handling HTML Tags
Tags that are not recognised by the system are
ignored completely.
There are many
suggestions in the official HTML 4.0 Specification [HTML] on how various
graphical elements of web pages should be represented by a non-graphical agent.
These suggestions were very useful in specifying how the parser should convert
the pages to plain text.
UML notation was not
used to specify the operation of the HTML parser because of its complex
recursive nature. In designing the parser the methods taught in the
“languages and their implementation” lectures were used, along with
selected sections of [CARROL 89]. A BNF grammar was used to formally
specify the parts of the HTML language that the project is interested in. The
advantage of HTML is that every new version is supposed to be backwards
compatible. This means that if newer versions of the HTML specification are
released that add extra features to the language, the parser should still be
able to parse the page without problems. In this situation any information
within the new language constructs will be ignored, meaning possible loss of
useful information.
The BNF specification for
the parser is shown in figure 4.8b.
HTML BNF Grammar
|
|
Alphabet:
textlex ::=
Set of all lexemes except < and & and
eof
specialid ::= Set of
special character identifiers, e.g. amp for
‘&’
other ::=
Set of all
lexemes
Grammar:
<HTML> ::=
( <TEXT> | <SPECIAL> | <TAG> )*
eof
<TEXT> ::=
( textlex
)*
<SPECIAL> ::=
‘&’ specialid
‘;’
<TAG> ::=
‘<’ <TAGID> (other)*
‘>’
<TAGID> ::=
( <TITLE> | <BREAK> | <COMMENT> |
<SCRIPT>
<STYLE> | <CAPTION> | <TABLE> |
<ENDTABLE>
<TABLEROW> | <TABLECOL> | <FRAMESET> |
<FRAME>
<NOFRAMES> | <LINK> | <LINKEND> |
<IMAGE>
<IMGMAP> | <AREA>
)
<TITLE> ::=
‘title’ (other)*
‘</title’
<BREAK> ::=
‘br’
<COMMENT> ::=
‘!—‘ (other)*
‘--‘
<SCRIPT> ::=
‘script’ (other)*
‘</script’
<STYLE> ::=
‘style’ (other)*
‘/style’
<CAPTION> ::=
‘caption’ (other)*
‘/caption’
<TABLE> ::=
‘table’
<ENDTABLE> ::=
‘/table’
<TABLEROW> ::=
‘tr’
<TABLECOL> ::=
‘td’
<FRAMESET> ::=
‘frameset’
<FRAME> ::=
‘frame’ (other)* ( <HREF> |
ε
)
<NOFRAMES> ::=
‘noframes’
<LINK> ::=
‘a’ (other)* ( <HREF> |
ε
)
<LINKEND> ::=
‘/a’
<IMAGE> ::=
‘img’ (other)* ( <ALTTAG> |
ε
)
<IMGMAP> ::=
‘map’
<AREA> ::=
‘area’ (other)* ( ( <HREF> (other)* <ALTTAG> )
|
(
<ALTTAG> (other)* <HREF> )
|
<ALTTAG> | <HREF> |
ε
)
<ALTTAG> ::=
‘alt’ (( ‘=”’ (other)* ‘”’ ) | (
‘=’ other ))
<HREF> ::= ‘href’ ((
‘=”’ (other)* ‘”’ ) | ( ‘=’
other ))
|
Figure 4.8b – BNF Grammar for
Parser
The parser uses a lexical analyser to retrieve the
individual “lexemes” (sometimes called “tokens”) from
the HTML file. The rules it uses to do this are shown in figure
4.8c.
Lexical Analyser:
|
|
White space and new-line characters are ignored
and not counted as lexemes
The following
characters mean the end of a lexeme:
< > = ” ; null eof
white space newline
|
Figure 4.8c – Rules for
Lexical Analyser
In certain cases it may not be desirable to
retrieve the text from the HTML file as lexemes. For example when retrieving the
URL pointed to by a link, the lexical analyser would probably split this into
more than one lexeme.
For example, if the URL
was:
http://www.testdomain.com/testfile.htm?parameters=”Test
Parameter”,”Param2”
Using
the normal rules for lexemes this would be split up by the lexical analyser into
ten different lexemes. In order to prevent this, in certain cases such as for
URLs, the text from the HTML file can be read directly without it being split
into lexemes. This greatly simplifies the parsing
process.
In the normal text on the page (i.e.
text that is not inside a tag), lexemes are read using the lexical analyser, and
sent to the output file with a white space character separating them. This is
necessary because the lexical analyser removes all white
spaces.


 Figure
4.4b – Sequence diagram for “sleep” mode


 Figure
4.6b – Breakdown of state A


 Figure
4.6f – Breakdown of state C2