Activity Diagrams
Contents:
0. Introduction
1. Diagram Notation and Meaning
2. Swim Lanes
3. Super-activity/sub-activity
4. Activity Diagrams and Use Cases
5. Comparison with State Diagrams
0. Introduction
These notes discuss activity diagrams with their associated notation:
start
stop
flow line
activity box
fork
join
branch
merge
The coloured pairs above go together as you'll see below. You should memorise the symbols and understand their meaning and usage.
Swim lanes and super-activities/sub activities are then discussed in two separate sections. A final section considers activity diagrams being used to sketch out use cases.
1. Diagram Notation and Meaning
Activity diagrams show the work flow in a system. They're used for many purposes both in large scale modelling and in modelling in the small, shortly before coding. Unlike conventional flow-charts, they are very useful for showing parallel processing.

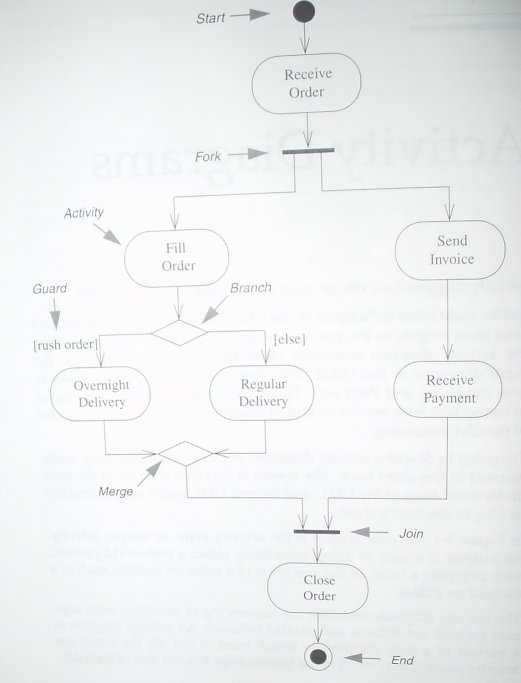
The diagram above shows the activities involved in processing an order for a customer.
In general the fork/join shows two or more asynchronous sequences of activities that need, nevertheless, to synchronise at various points shown as joins. At a join, all the incoming arrows must have arrived before the outgoing one can fire.
A branch/merge shows an alternative, rather like the if...else in programming.
Note that the start and stop symbols are the same as those use in state diagrams. Start is a black circle; stop is a black circle with a ring round it.
Exercise: Explain all the syntax on this diagram and its semantics. (This question has a suggested answer below in blue).
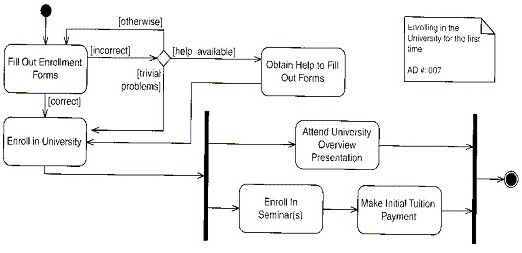
Here we see an activity diagram with the rules not always obeyed. For example there should strictly be one line leading out of “Fill out enrolment forms” which then branches via a diamond box into the [incorrect] and [correct] routes. However UML is meant to serve people, not the other way round, so this is not a problem, unless, perhaps, the diagram is being compiled by a computer into, say, Java code.
Note that the set of guards from each branch form a complete set. This means that they cover all possibilities without overlap.
The fork/join section is interesting. This is what it says in words:
You (the enrolling student) must do all the following activities:
1. Attend university overview
presentation
2. Enrol in one or more seminars
3. Make initial tuition payment
You can do them in any order that you like save that 2. must precede 3.
Thus you can do:
123
213
231
but not, say, 312
The idea of UML is that writing out things like this in words and reading things like this in words drives a lot of people completely round the bend. Expressing it diagrammatically makes it easy. If you don’t think so, it could just be because you haven’t yet become fluent in UML. There are other examples where the difference between UML expressiveness compared with words is even more dramatic.
2. Swim Lanes
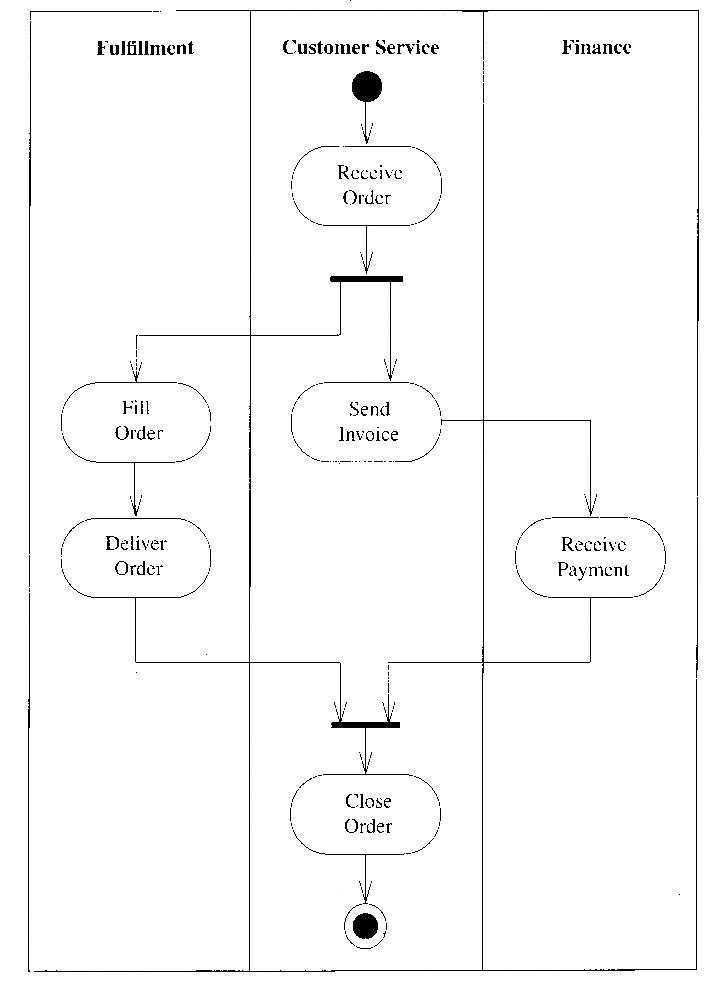
One of the drawbacks of activity diagrams is that they don't give any guide to responsibilities, and as such aren't very object-oriented. One way of partially getting round this is by introducing swim lanes. Here's the origintal activity diagram above re-drawn with swim lanes.
3. Super-activity/sub-activity
An activity diagram can be decomposed into subactivities, or alternatively a group of activities can be wrapped up into a superactivity. Here's a diagram to illustrate this:
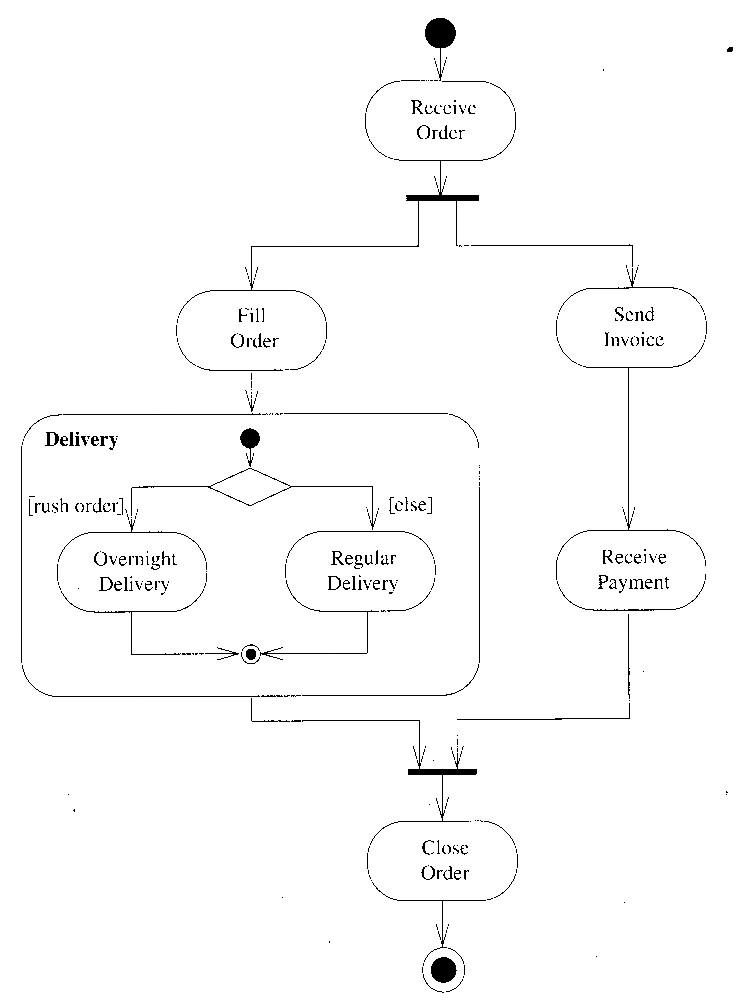
We could have drawn the above diagram without showing what's inside the Delivery activity In other words we'd have a small box, the same size as the Fill order box, but with the word Delivery in it. Then we could place the activity showing what's in inside the Delivery box in a quite separate diagram.
4. Activity Diagrams and Use Cases
As you know already, use cases are represented by using structured text. You also know that some developers like to illustrate their use cases with use case diagrams and you've learned how to do this.
It may be of interest to know that some developers find activity diagrams handy to sketch out a use case. Others use them to show the essential sequencing rules that a system must follow in regard to use cases; in such usage each blob on the activity diagram can represent a use case and the activity diagram shows which use cases must be complete before some other one starts. In some senses, then, they have roles similar to the roles of Gannt charts.
(Of course, some developers don't use either type of diagram, when developing use cases, and that's acceptable too.)
4. Comparison with State Diagrams
Activity diagrams have some similarities to state diagrams. Some of the symbolism is the same, such as start and stop and the idea of guarded transitions from a state, represented by the use of square brackets. There are differences such as there being no events in activity diagrams; it follows then that a state in an activity diagram can only be exited when the activity associated with it is complete.
A state in a state diagram need not have any event to provoke a departure from the state and be an activity state alone. ALL states in an activity diagram are of that sort, not just some of them, as would be the case in a state diagram.
To some extent activity diagrams can be regarded as a special form of state diagrams in which all states are activity states and where transitions occur once the activity associated with a given state is complete.
4. Three more examples of activity diagrams
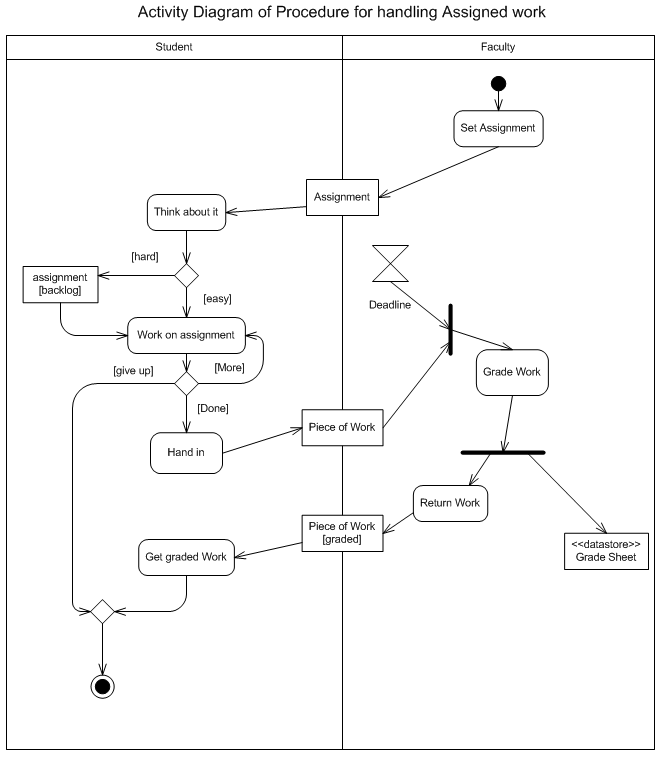
(a) In the activity diagram below, we see swim lanes and the use of rectangles between the swim lanes to represent the transfer of documents. In addition there's an hour glass type symbol (two triangles, joined at their points), to represent an event related to the passage of time.
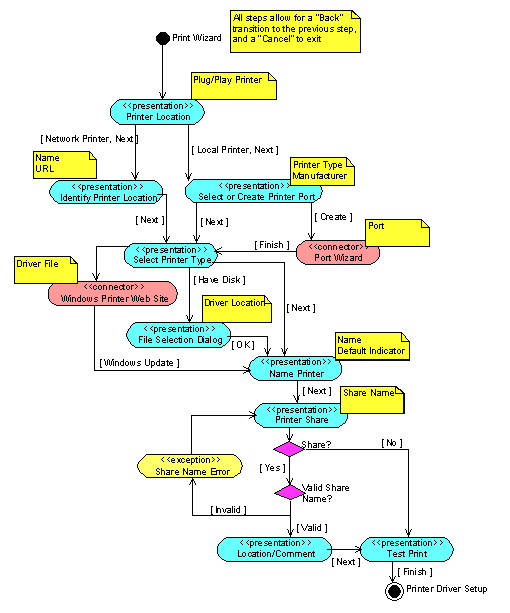
(b) I'm not going to attempt to explain the details of this following example (see how much you can understand yourself). What this example shows is the size of some activity diagrams:
(c) In the diagram below, we see five activity states:
Reserve Itinerary
Send Itinerary
Itinerary Confirmed
Book Itinerary
Cancel Itinerary
In reserve itinerary (top left) an itinerary is reserved (and no one else can book that place for the duration of its being reserved). Send itinerary is a signal that is sent and starts two possible parallel processes. One of these processes is that the itinerary might be confirmed by the operator and by the client (confirm itinerary) and then booked (book itinerary). The other is that 48 hours elapses without these processes being carried out. That leads to cancellation of the itinerary (cancel itinerary) and its being made available once again to other customers. There is in effect a race to the end point at the right of the diagram.
And with that we leave the topic of activity diagrams, although some people have said that there's now so much syntax that can be incorporated into such diagrams, that one could write a whole book.