Physical Diagrams
Table of Contents:
1. Introduction
2.
Component Diagram
3. Nesting of component diagrams inside deployment diagrams
4. Symbols used and relation to package diagrams
5.
Meaning of the first diagram
6.
Visual Stereotypes and physical diagrams
7.
When to use physical diagrams
8. Ports
9. An example physical diagram using the
new notation
10. Summary of symbols used on both types of physical diagrams
1. Introduction
These are used when you want to show physical information that's different from the associated logical information, represented on a package diagram.
There are two types of physical diagram provided in the UML
You create these models to:
2. Component Diagram
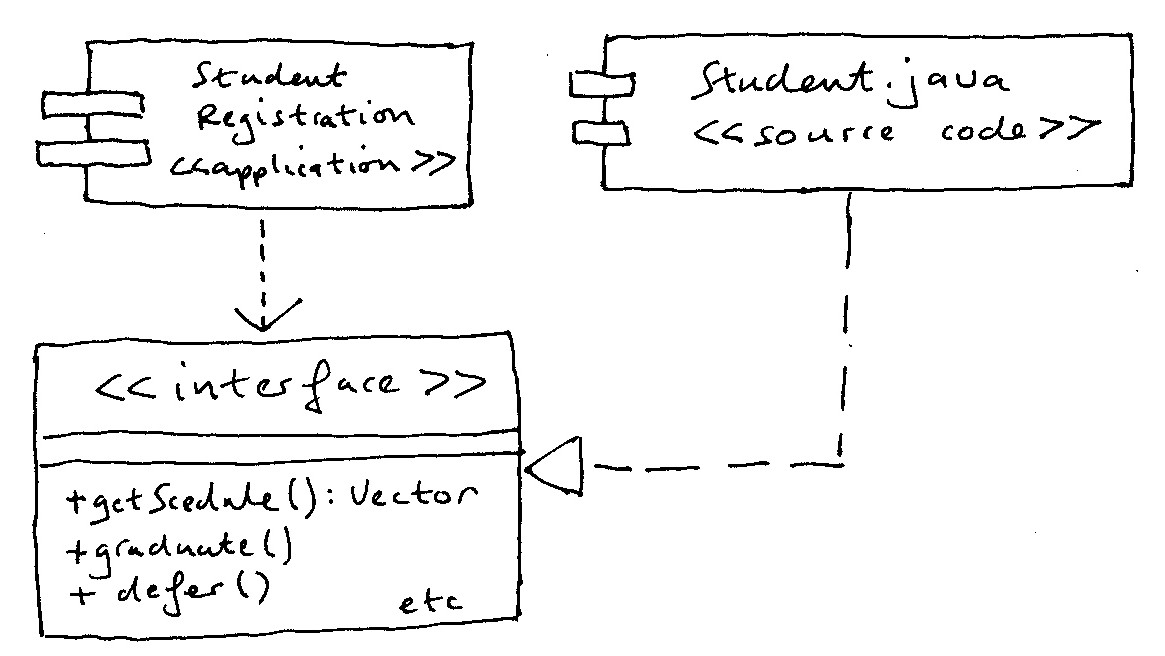
The different high-level reusable parts of a system are called components. Component diagram shows physical, deliverable and sometimes separately purchasable artefacts as opposed to the logical ideas that predominate in the rest of the UML. These artefacts could be java source code files, applications, .htm files, or even .doc files etc.
Component diagrams use a box called a component (you see it with the jutting out bits to the left). The components can be almost anything and so the use of stereotypes to define precisely what sort of thing it is is very important. Here we see that the Student Registration application depends on a particular interface. The Student.java file implements that interface. (Whether Student.java contains just the Student.java classes or other private classes as well, we don't know, and this diagram isn't meant to tell us these things. It represents physical stuff, remember, not logical stuff).
An application is itself a physical, usually separately purchasable, runnable entity, reinforcing the ideas of the physical nature of a component diagram.
Here's a list of some of the stereotypes you might find on a component diagram:
<< application >>
<< database >>
<< document >>
<< executable >>
<< file >>
<< infrastructure >> such as a persistence framework or
audit logger
<< library >>
<< source code >>
<< table >>
<< web service >>
<< XML DTD >>
3. Nesting of component diagrams inside deployment diagrams
Very often component diagrams are nested inside deployment diagrams. There are two examples of such hybrid diagrams in this section of the notes.
Here's the first:
and here's the second:
(There's a slight confusion of terminology; each of the diagrams below is in fact a deployment diagram, the first of which is a deployment diagram that shows how a developer might develop the software. The second deployment diagram is how the system will be deployed as a revenue-earning service. So you might call the first a development deployment diagram and the second a deployment deployment diagram!!!)
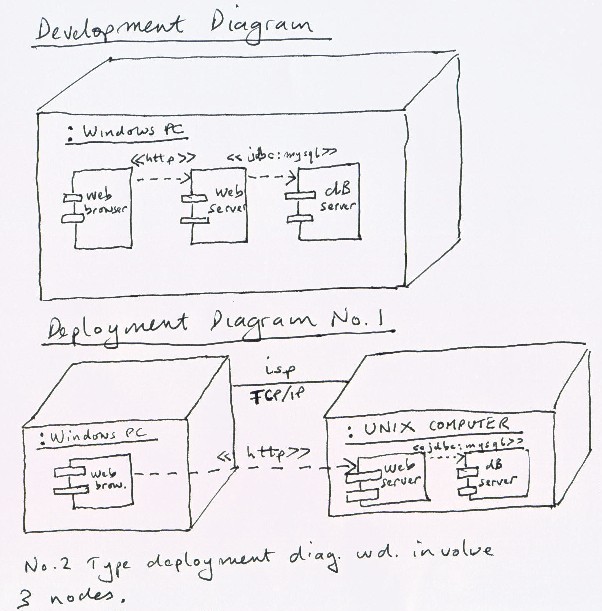
You can get the deployment diagram alone by ignoring the funny looking rectangles that are contained in the three-dimensional boxes, as well as the lollipops and connecting broken lines.
4. Symbols used and relation to package diagrams
Component diagrams have two main symbols:
(a) a rectangle with two little rectangles down the
left side, representing a component, and
(b) a broken open-arrowed line.
Draw each of these as a way of reinforcing your knowledge.
In addition, there is
(c) the lollipop symbol representing an interface (see later in the web page)
Draw symbols (a) and (b) and, if you're on a second, third etc reading symbol (c) as well. Do this each time you read the notes as a way of reinforcing your knowledge. Better still stick the symbols you draw on your wall or on post-it stickers on the side of your computer screen, or something like that. Whatever works for you.
So much for the syntax. What about the semantics? Well, as in package diagrams, the line represents dependency, the non-arrowed end depending on the arrowed end. Very often components are identical to packages but sometimes they're not. A package may be spread across two or, exceptionally, three components according to how the system is delivered to the customer and eventually deployed on one computer or the other.
Deployment diagrams have two main symbols:
(a) a three dimensional box, representing a node, and
(b) a solid un-arrowed line.
(Draw them to help your memory!)
A node is a computational unit of some sort from a mainframe at one end of the scale down to a sensor at the other. Normally however a node has some sort of memory. The lines between the nodes represent wired or wireless communication pathways.
Lines may be stereotyped (using the UML approved <<...>> delimiters). For example, on the second diagram, you can see the stereotype:
<<jdbc:mysql>> meaning that the connection is the abstract java data base connectivity actually realised by a driver for the mySql data base package.
isp meaning internet service provider should also have been enclosed with the stereotype delimiters to be strictly accurate. (Sorry for that omission!).
Note the lollipop, that we met earlier in logical diagramming making a re-appearance in the first of the two physical diagrams.
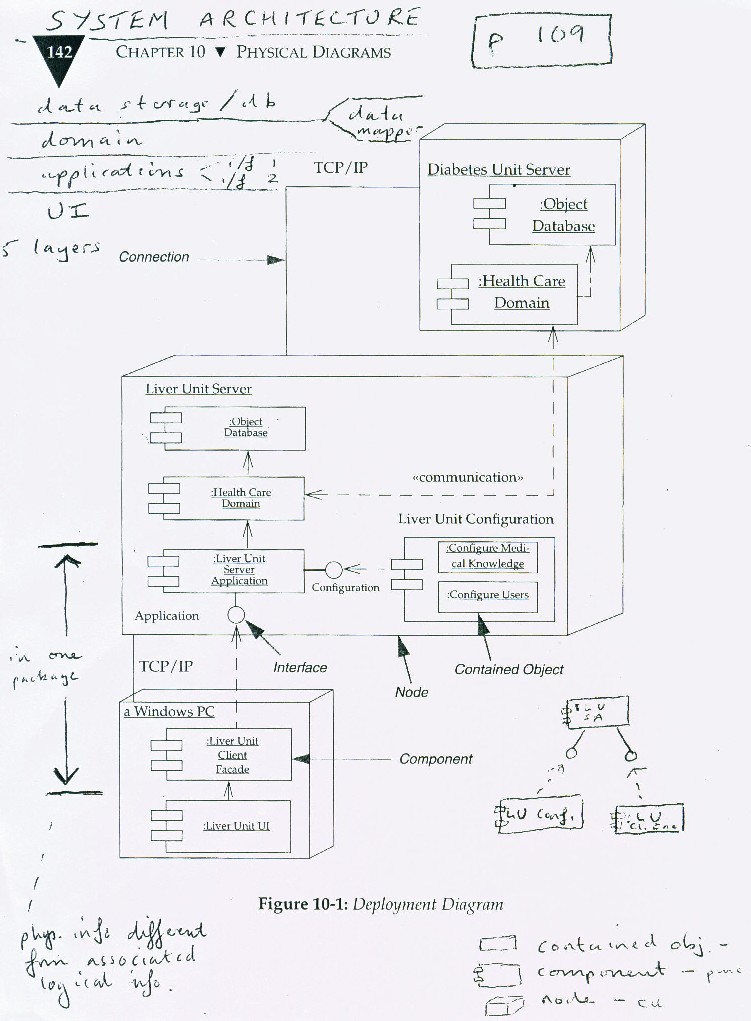
5. Meaning of the first diagram
Here's the first diagram drawn again for convenience:
The Liver Unit UI and the Liver Unit Client Facade both run on a Windows PC. The Liver Unit UI is dependent on the Liver Unit Client Facade, since it calls specific methods on the facade. Although the communication is two way, in the sense that the Facade returns data, the Facade is not aware of what is calling it and is thus not dependent on the UI. In contrast, in the communication between the two Health Case Domain components, both are aware that they are talking to another Health Care Domain component, so the communication dependency is two-way. The two domain components run on separate nodes.
A component may have more than one interface, in which case you can see which components communicate with each interface. In the diagram, the server application has two interfaces. One interface is used by the application facade running on a PC; the other interface is used by a configuration component running on the server.
The use of multiple Health Care Domain components is hidden from its clients. Each Health Care Domain component has a local database.
6. Visual Stereotypes and physical diagrams
People often draw these kinds of diagrams with symbols that look like the various elements. For instance, they use special icons for servers, PCs and databases. This is legal in the UML. You can treat each icon as a stereotype of the appropriate diagram element. Usually such icons make the diagram easier to understand, although they get messy if you show nodes and components together as in the diagrams (above) on this web page.
Shown above is an example of this sort of diagram. Notice that it's a valid deployment diagram, because the lines between the icons are solid. (If they were broken lines, say, then there would be a syntax error.) This sort of deployment diagram is sometimes referred to as either a:
network diagram
or
technical architecture diagram.
The UML doesn't specify any standards to be used in the icons. Thus you're free to choose any reasonable icons you can find in libraries of these things.
If you replaced each of the pictorial icons with three-dimensional boxes you'd have a standard deployment diagram, one without any component diagram trying to squat inside it. You could, however, put stereotypes inside each box at their tops to read <<firewall>>, << payment processing gateway>> etc. Below these stereotype labels you could optionally show the components in each of the nodes, just as on some of the previous diagrams in these notes.
7. When to use physical diagrams
Traditionally people have been drawing this information informally, but gradually they're fomalising their diagrams to fit in with the UML. You can draw these diagrams whenever you have to show physical information that is different from the associated logical information.
You can think of physical diagrams as relating to the way the system is purchased or delivered, rather than the way that it's developed. The way the system is developed is represented on package diagrams and the like.
You can also think of package diagrams as being related to the way programmers think and understand the system they're developing. Physical diagrams relate to the way the marketing people think about delivering the system.
Someone called Ralph Johnson
http://www.c2.com/cgi/wiki?DoComponentsExist
in a paper (2004) discussing whether there were such things as components wrote this:
Components are not a technology. Technology people seem to find this hard to understand. Components are about how customers want to relate to software. They want to be able to buy their software a piece at a time, and to be able to upgrade it just as they can upgrade their stereo. They want new pieces to work seamlessly with their old pieces, and to be able to upgrade on their own schedule. They want to be able to mix and match pieces from various manufacturers. This is a very reasonable requirement. It is just hard to satisfy.
Later on in his paper:
It's also something that happens quite regularly, Photoshop for example, is a perfect example of allowing plug in components to extend the functionality of the base program, and anyone can build plug-ins, same with audio software. Components most certainly exist.
Here's some other things he said:
I am not saying that components are about users. I'm saying they are about customers. It is the people who pay for software who are driving components. That is why sales and marketing people are talking about them. They know that people want this. So, they tell us to make it...
and still later:
People do buy software in pieces and plug it into the rest of their software and have it work. In that sense, components exist. They aren't perfect, and the components you want often don't exist, but the fact that you can buy a new program and have it fit in with the others you already have shows that, by my definition, components exist.
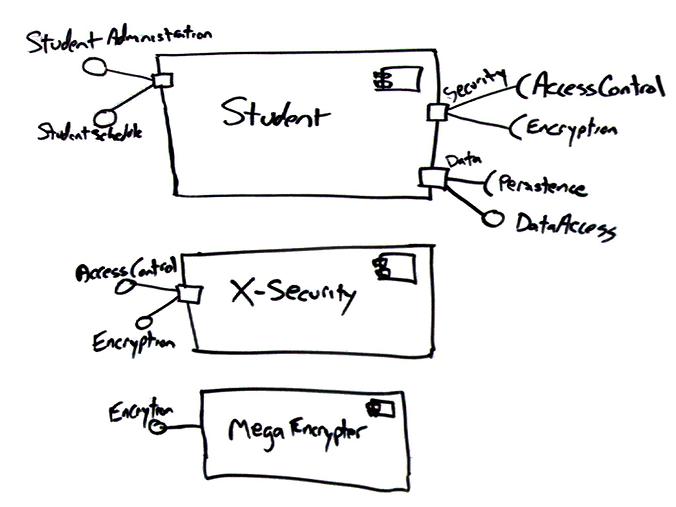
8. Ports
A port is a feature of a component that specifies a distinct interaction point between the component and its environment. Ports are depicted as small squares on the sides of components.
For example the diagram below shows a component diagram which contains three components. Note that ports can be named, such as the Security and Data ports on the Student component.
9. An example physical diagram using the new notation
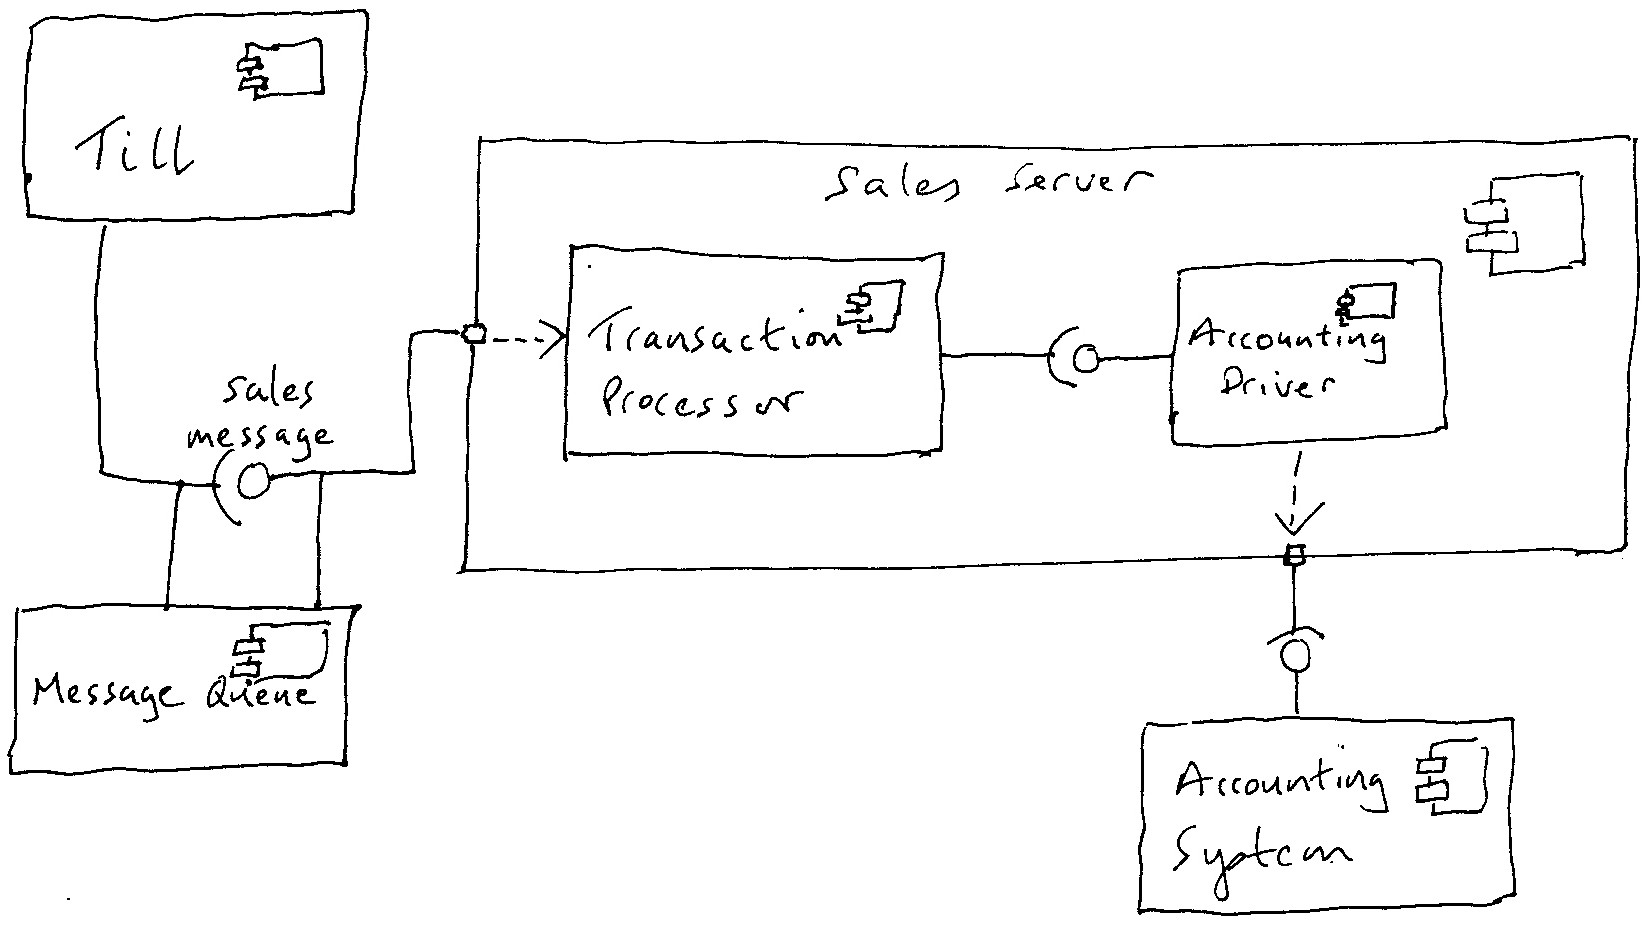
In this example, a sales till can connect to a sales server component, using a sales message interface. Because the network is unreliable, a message queue component is set up so the till can talk to the server when it is up and talk to the queue when the network is down; the queue will then talk to the server when the network becomes available. As a result, the message queue both supplies the sales message interface to talk with the till and requires that interface to talk with the server. The server is broken down into two major components. The transaction processor realises the sales message interface, and the accounting driver talks to the accounting system.
Note that the newer UML 2 notation is used here for components. It's hard to draw as you can see, so if you're casually drawing on paper or on a whiteboard/chalkboard, you might just want to stick with the old notation. Alternatively you can just draw a rectangle and put the stereotype <<component>> at the top.
10. Summary of symbols used on both types of physical diagrams:
Deployment diagram:
3-D boxes
stereotyped unbroken lines
Component diagram:
2-D boxes with jutting out bits (or variations of this)
broken lines each with a single arrow at the end
lollipops
cup shapes at the end of unbroken lines
little squares on the perimeters of the 2-D boxes from which the lollipops or
the cup shapes emerge (see 9. above)
When revising, be sure to draw these shapes on a piece of paper, each time
you read these notes.
Self-assessment questions:
1. What is the symbol for a component?
2. What is the symbol for a node on a deployment diagram?
3. What does a node on a deployment diagram represent?
4. How do we represent dependency?
5. What does a lollipop represent?
6. Why is it necessary to have physical diagrams in addition to logical ones?
---------------------------------------------------------------------------------------------
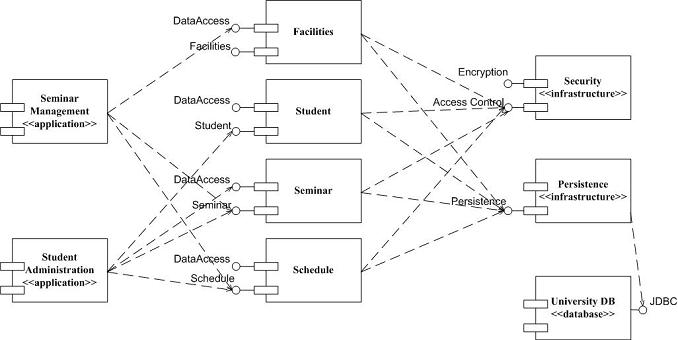
An extra diagram for discussion in class:
Appendix:
Some internet notes that might explain the ideas of physical diagrams better than I do:
Component diagrams:
http://www.developer.com/design/article.php/3115721/Component-Diagrams-in-UML.htm
Deployment diagrams:
http://www.developer.com/article.php/3291941