Contents:
0. Introduction
1. Sequence Diagrams (one form of interaction diagram)
2. Centralised vs Distributed Design
3. Collaboration Diagrams (the other form of interaction diagram)
4. Summary
Pre-requisite knowledge:
An underlined name means an object. A non-underlined name means a
class. An object is an instance of a class, in much the same
way as I'm, so to speak an instance of the class Human.
Here's an object bigRectangle
Here's an object where its type is specified too
bigRectangle:Rectangle
Here's an anonymous object of type Rectangle
:Rectangle
Here's a class Rectangle
0. Introduction
There are two types of interaction diagrams: sequence diagrams and collaboration diagrams.
Collaboration diagrams were renamed communication diagrams in the latest edition of UML. This is for a good reason. Nevertheless, I'll stick to the original name for now, in case I forget to use the new name in lectures and confuse people. It's worthwhile to know both names, given the fact that many developers are not going to change their terminology in too much of a hurry, human nature being as it is.
Relevant revision: A scenario is a set of steps describing just one interaction between a user and a system. A use case is a set of scenarios tied together by a common user goal.
1. Sequence Diagrams (one form of interaction diagram)
Sequence diagrams are used to show how objects send messages to each other in order to provide the functionality represented in a use case, or more usually, just one scenario. As you read down the page you see the order in which the messages are sent.
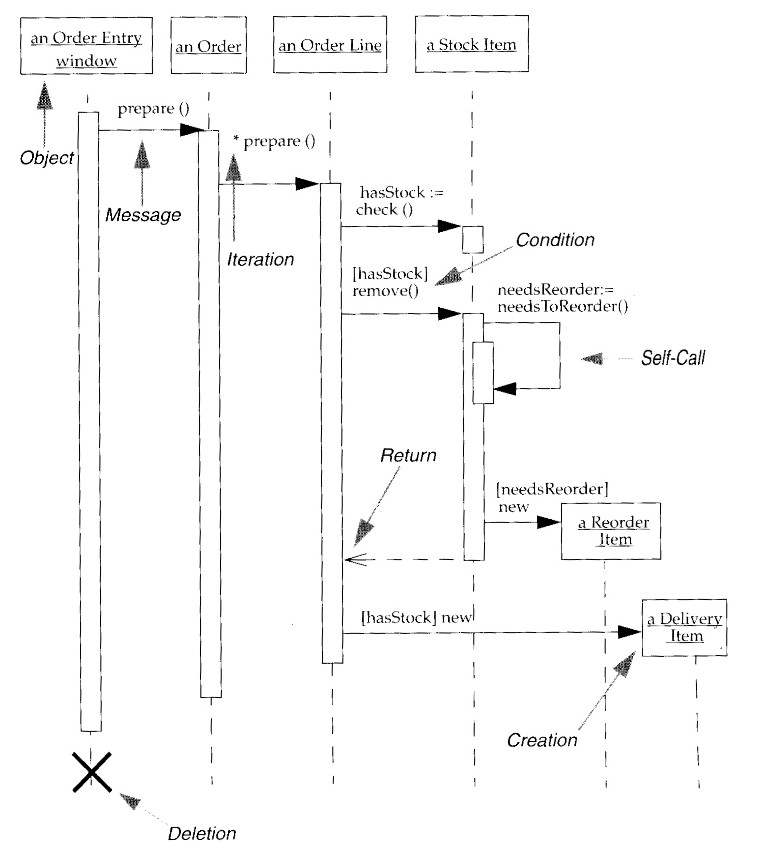
Note that each of the rectangles at the top of the diagram is underlined. This means that each is an object, an instance of a class. The horizontal arrowed lines shows the messages that are sent from one object to another. Sending a message to an object corresponds to calling a method of the object's class. For example stockItem1.remove(4); would presumably be a message to stock item number 1 to subtract 4 from the number attribute that represents the amount of it in storage. Similarly stockItem567.add(32) would be a message to stock item number 567 to add 32 to the number attribute that represents the amount of it in storage.
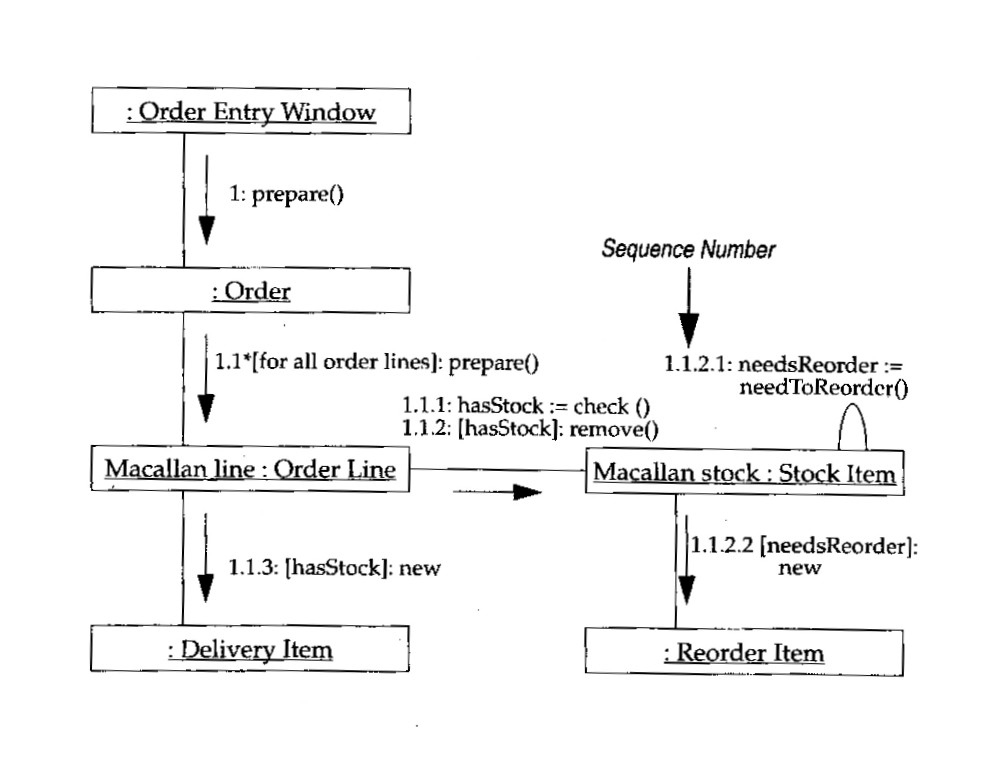
We see then that if we have anObject.message(), then that translates in sequence diagram terms to a horizontal arrow with message() on it heading on to the vertical life line of anObject. When an object sends a message to itself in Java, we simply have message(), with no full stop and no recipient, preceding the message. An object sending a message to itself is shown on a sequence diagram as a loop back on to the same life line. See the diagram above.
Having said all of the above, it must be explained here that a sequence diagram need not represent actual software but rather how a business is run. Sequence diagrams can thus be used to represent entire enterprises regardless of computerisation at one end of the scale or, at the other end, actual code.
What the diagram above shows is a prepare command being sent to an order, and this object in turn sends a prepare command to each of its order lines. The * on the diagram above represents the iteration involved here. Each order line is for a certain quantity of a particular stock item so a message is sent to the relevant stock item object to see if there is sufficient in stock to meet the order. Only if the boolean hasStock is returned as true is a message sent to the stock item to deduct the relevant quantity. The stock item interrogates itself to see if stock levels have fallen below the threshold and if so a new stock item is created. Note that [hasStock]remove() is effectively the UML notation for the Java:
if(hasStock)
remove();
The square brackets surrounds a boolean and forms what's known as a guard.
The different scenarios in a sequence diagrams are shown by the guards (the Boolean conditions in square brackets). Sometimes it's better to draw a separate sequence diagram for each scenario and have fewer guards on the diagram. Thus, as has been hinted at before, it's probably more true to say that a sequence diagram usually represents the interaction among objects in solving the functionality of just one scenario, not a whole set of them.
Thus we could possibly re-define sequence diagrams as showing how objects send messages to each other to provide the functionality represented by a scenario.
Sequence diagrams are good at letting you see the actual program so to speak, i.e. the sequence of commands the computer executes in the order they're executed. Object-oriented programs tend to hide the program, in the traditional sense, since there are methods scattered around in many objects. Sequence diagrams bring the program out to the fore and make it manifest!
2. Centralised vs Distributed Design
Study the following two diagrams and then read the notes below.
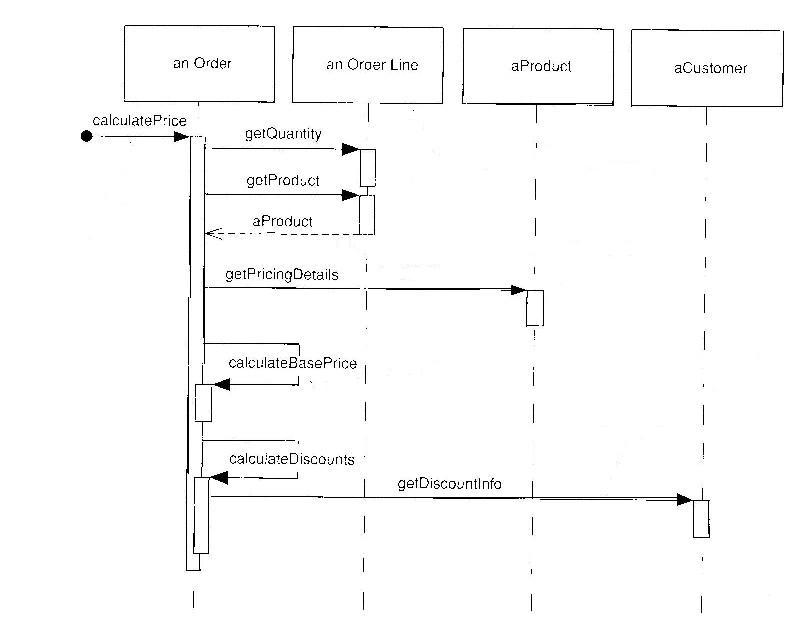
Sequence diagram above showing centralised control (not so good)
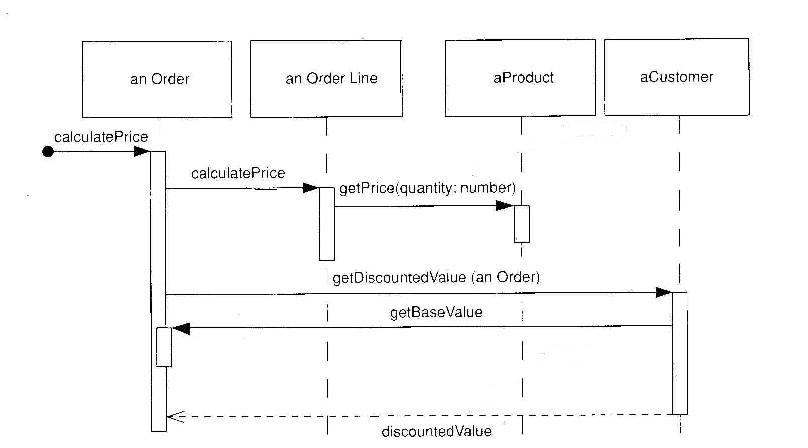
Sequence diagram above showing distributed control (better)
Shown in the two diagrams above are two strategies for solving a problem. The
first shows a centralised solution where
one class does all the work and the
second shows a distributed solution where the work is shared among
classes.
In the second, each object was given something to do and was not
just a repository of data, with setters and getters only
as their member methods. The second is better because it tends towards
producing reusable objects, allowing low coupling
and high cohesion. The
trade-off is sometimes that the objects thus created may result in a program
that takes longer to
execute. Nothing is without its price.
Sometimes sequence diagrams are drawn as a way of highlighting an
over-centralised design which can then be altered
to a less centralised design. It's often only by drawing a sequence diagram that
such a defect can be noticed and then rectified.
3. Collaboration Diagrams (the other form of interaction diagram)