State Diagrams
A state diagram shows the different states that an object can get into as the result of the messages that are sent to it by other objects and how they respond to messages in different ways according to the state they are in.
A state diagram shows life as lived by a particular object as it participates in numerous use cases (each being made up of a number of scenarios).
Whereas interaction diagrams show many objects participating in one scenario, state diagrams show one object participating in many scenarios. In principal if we looked at all the interaction diagrams in which the object in question participates, and noted all the messages it sends to itself or other objects, or that is sent to it by other objects, we could accumulate all that information and produce a state diagram for that object. I'm not, however, saying that's actually how you'd go about drawing a state diagram, in practice.
The states correspond roughly to the possible sets of an object's attributes, but not entirely since several sets might effectively constitute one state. Here's an example:
Example 1:
Suppose a library book object has an attribute to represent the number of copies of the book in question that are held by the library. There are only two significant states of the book, borrowable and non-borrowable,. Thus all the number-of-copies attribute values from 1 upwards can be lumped into one state and their being 0 copies in another state. A borrow message to a library book with 1 copy left on the shelf moves it into the non-borrowable state and a return message to a book in a non-borrowable state moves it into the borrowable state.
We can see from the above example, that the behaviour of an object, when a message is sent to it, can depend on the state it is in. Similarly the response an object makes to a message can cause it to change its state.
When you've studied example 2, below, draw a state diagram for a library book.
Example 2:

Figure 1 (A machine drawn version of the above diagram is available at this link. If you're using a laptop, you may have to push the top of your screen back to see the machine-drawn diagram clearly.)
Note (from Figure 1) that each of the states that an object can be in are represented by rectangular boxes with rounded corners. Each state has up to two compartments. The top (or only compartment) is the name of the state, and the second (lower compartment) shows any activity associated with the state. Note carefully the syntax associated with an activity: do/activity. The lines joining the states represent transitions. Each of these represents a quick movement from one state to another and each bears a label event[guard]/action where one, two or all three of the elements may be missing. Thus we can have
event
event[guard]
[guard]
action
event/action
/action
[guard]/action
event[guard]/action
or nothing at all!
The notes below refer to Fig 2. [Do your reading in this order (a) read the notes, (b) study figure 2 (c) read the notes again.]
event alone means that the transition
[from
state b to state
c say (see fig 2)], will take place when the event occurs.
event[guard] means that the transition to
c will take
place when the event e occurs provided that the
guard
g is true.
[guard] means that the transition to
c will take place
when the activity associated with the state b is finished, provided that the
guard
g is true.
event[guard]/action means that the transition from
b to c will take place if the event occurs provided the
guard
g is true. If
the transition occurs then the action a will take place.
In any case, if there is /action on its own or in conjunction with other elements, that action accompanies the transition.
The figure below summarised the event[guard]/action notation and its meaning. We read the diagram below as:
While in state b, if event e occurs, provided condition g is true, a transition is made to state c and the action a occurs.

Figure 2
An event can interrupt an activity. This means that there's a flaw in very first diagram above in that delivered event could occur as the package was being made up, resulting in a package being thrust into the van without having postage applied or being properly sellotaped. Given that state diagrams are usually not compilable (rather merely represented on white boards to help developers get their ideas sorted out), this objection might be regarded by many developers as being pedantic and nit-picking. Nevertheless, the problem can be resolved by introducing another state between the dispatching and delivered state, or, less formally, introducing a constraint, expressed in natural language and placed between braces. That constraint would simply say that the delivered event can't occur until the parcel is made up. (Aside: Do you remember the use of constraints in class diagrams? Well, it's the same sort of thing here too.)
Note that the set of guards on the transitions leading out of one state must form what is referred to as a complete set. This means that all possibilities must be covered by the guard, and there must be no overlap. An example of a complete set of guards, for processing exam results between 1 and 100 might be
[mark < 40]
[mark >= 40 && mark <= 80]
[mark > 80]
Each mark falls into the range of one of the guards and no mark falls into more than one range. In other words each mark is in precisely one guard's range. Note that the set of guards in the order system example above is complete.
An activity is associated with an
state.
An action is associated with a
transition.
In implementation terms, both an activity
and an action are method calls within an
object, i.e. methodCall(...)
In implementation terms, an event is
associated with a method call from another object, i.e.
objectName.methodCall(...)
The diagram below shows the first diagram summarised assuming that we were to add a cancelled state to which a transition could be made from each of checking, dispatching or waiting state, but not, of course, from the delivered state.

Figure 3
We could show the three active states, checking, waiting and dispatching in the active state, either by nesting them in the active state or else representing them on a separate diagram.
Parallel activities shown in state diagrams

Figure 4
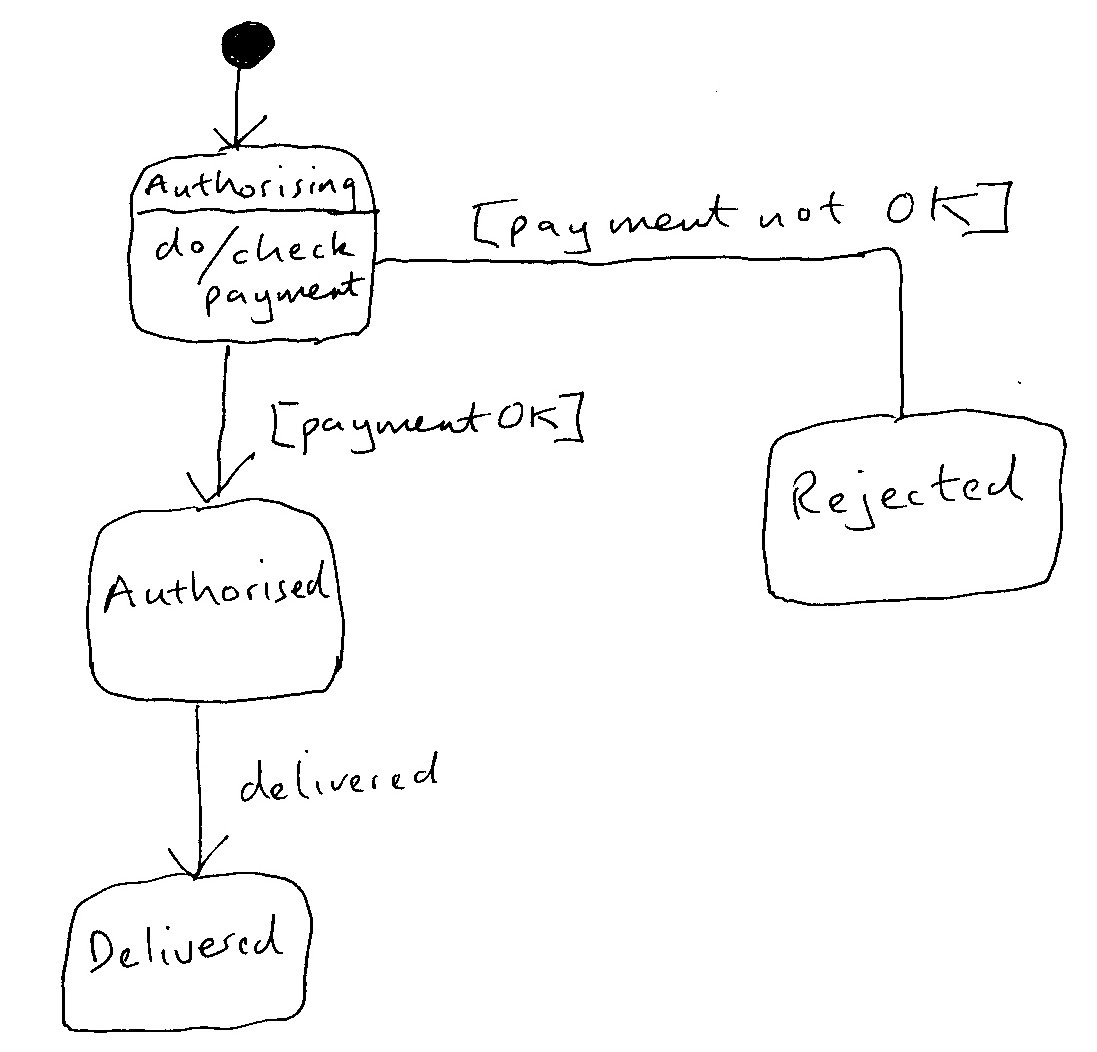
The diagram above shows payment authorisation in respect of the order process shown in the first diagram. It is something that can occur, in a back office, at the same time as the order fulfilment in the warehouse. It too brings us into the delivered state. Notice the two guarded transitions from the authorising state and the fact that there are no events associated with either of these transitions. This means that one or other of these transitions will take place after the activity (do/check payment) in the authorising state ceases.
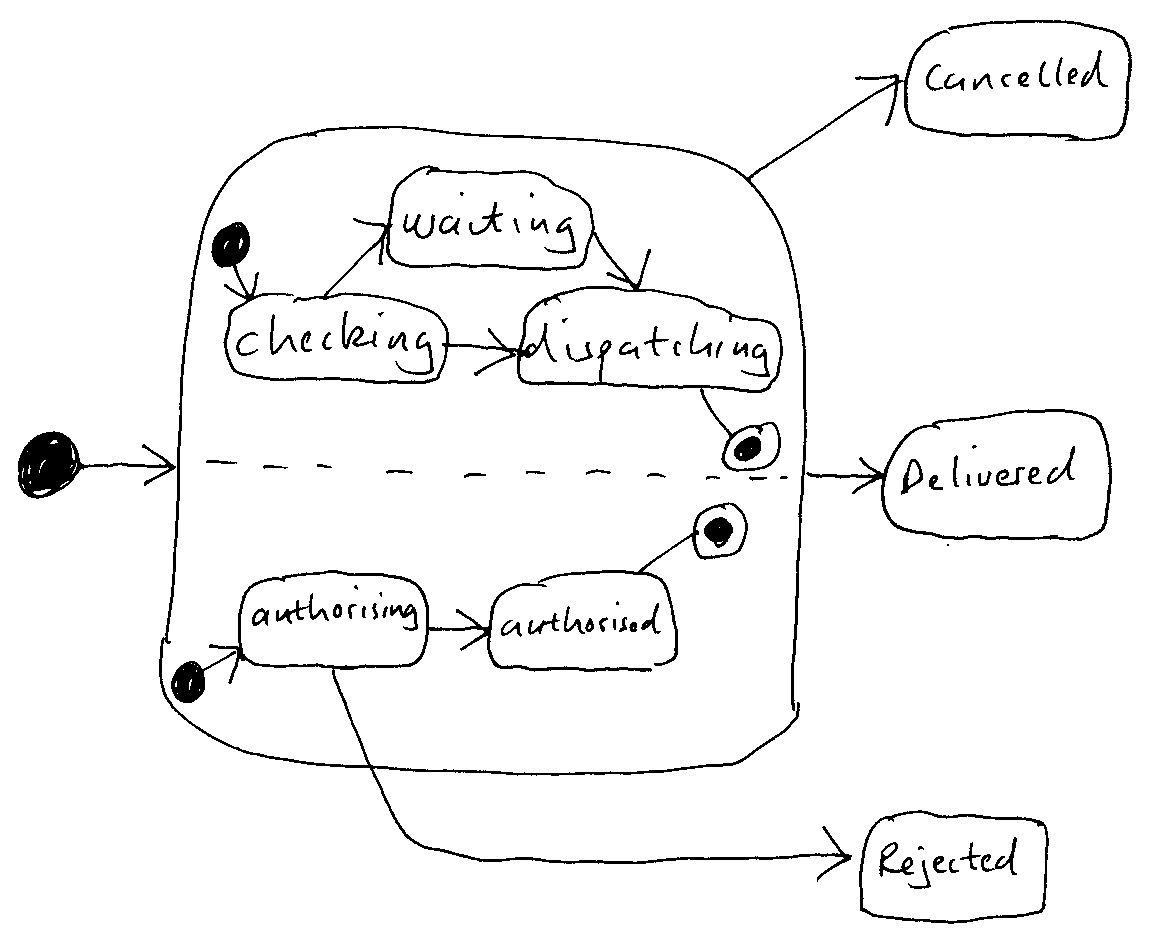
The two state diagrams, one for the warehouse, the other for the office, can be combined into one below. We have an active state at the left (we could have put the label active at the top), and three states on the left, cancelled, which is when the client intervenes to abort the order, rejected, which is when the seller intervenes to abort the order, and success, namely delivery.

Figure 5
We could summarise the above diagram, by using the diagram in Figure 2, but this time adding in yet another transition out of the active state to a rejected state, bearing the label rejected. Thus we would have an active state leading to three possible terminating states: cancelled, delivered and rejected.

Figure 6
Revising and learning more about state diagrams by question and answer:
1. What are the symbols used on state diagrams?
rectangle with rounded corners, unbroken arrowed lines, solid circle, solid circle with a ring around it.
2. What are the two definitions of state?
(a) Each and every distinct set of attributes is a
state. (b) A state represents a unique way in which an object will respond
to events.
The second of these two involves grouping the sets in the first into bundles.
For example, a library book with four copies can be in five states depending on how many are borrowed. However all the states with 1 or more copies can be grouped together insofar as they respond in the same way to a borrow request event.
3. Distinguish between state and transition.
If a state is as thought of above under definition (b), then a transition is a movement from one state to another, in a very short time compared to the time typically spend dwelling in a particular state.
4. Distinguish between activity and action.
An activity is associated with a state whereas an action is associated with a transition. Each corresponds to an object invoking one of its own methods. (An event incidentally corresponds to an object in one class invoking a method in another class.)
5. How do state and transition relate to activity and
action?
See answer to question 4 above.
6. Describe the syntax shown on a transition and how it relates to movement from
one state to another?
e[g]/a on a transition going from, say b to c. The label is read as follows. While in state b, if event e occurs, then provided that the guard, g, is true, a transition is made to c and also the action a occurs.
7. How many of the items of the label on a transition must be present?
none, one, two or three
8. How is a state exited if there is no event on the transition label?
When the activity associated with the state is complete.
9. Is it necessary to have a start and stop symbol on each state diagram?
Discuss.
Only if it's helpful. Using a transition from start to a state, shows the state the system will be in when boot up takes place. For example a new library book probably boots into borrowable if the book appears in the library together with its quota of copies, none of which have yet been borrowed. A transition from a state to stop indicates that the system requires rebooting, and until such time as it is re-booted, the state diagram is non-operable. For example, in the ogre's safe example, if the killer rabbit is released, the system has no way of re-caging him, and so the state diagram is derailed awaiting re-booting.
10. How many classes does a state diagram relate to?
exactly one
12. How many use cases does a state diagram relate to?
any number
13. Are state diagrams commonly used by people designing systems? Discuss.
Probably not, unless it's a controller system for a fire/burglar alarm system, industrial process, a railway/aircraft network, a real-time hospital patient monitoring system etc. In other contexts, usually an object's class diagram is so trivial that it's not worth bothering to draw it. Often the need to draw a state diagram for a class, indicates that the system has been badly designed and ought to be redone, using CRC cards, so as to create a more balanced assignment of responsibilities among objects, thereby eliminating the need to draw state diagrams to clarify what's going on.
What's written in the paragraph above could be subject to disagreement, debate and different views among the expert practitioners of object-oriented development. The state diagram we discussed for the on-line shop is probably a situation that runs counter to the general rule.
14. Compare and contrast state diagrams with activity diagrams.
In UML 1, activity diagrams are a special case of state
diagrams. Activity diagrams would be thought of as state diagrams in which
the reason for departure from a state is the completion of the activity
associated with the state, rather than the occurrence of an event. Thus
the states on an activity diagram are activity states rather than waiting
states.
Example 3 - the lifetime of a college class
The diagram below shows the life of a college class showing three states that it can be in:
enrollment: where the class hasn't yet begun its teaching
being taught: where the teaching has begun and not yet ended
final exams: where the teaching is ended and the final exams are being
sat.
Note the events that can cause transitions. For example a closed event bring the state diagram to an end; it the class continues to exist, perhaps in archival form, then it ceased to be the concern of what is being modelled here.
The event of student resignation can lead to two possible states according to whether it's the last student who has resigned or not. Hence the guard [class.size > 0] and [class.size = 0].
Not that the start state (solid black circle) and the end state (solid black circle with a ring round it) can be regarded as states.

Figure 7
Example 4 - the lifetime of a college lecturer
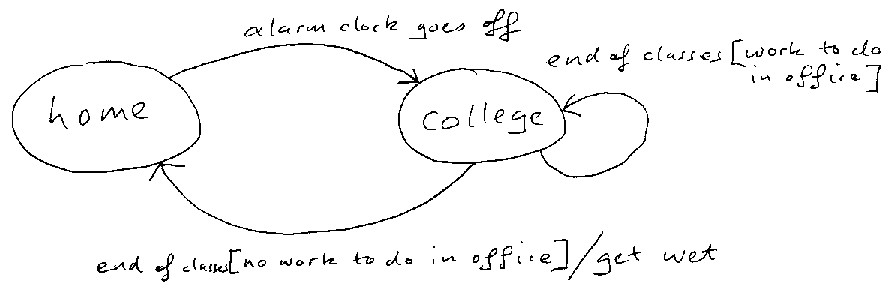
Having studied the lifetime of a college class, let's look now at a diagram showing the lifetime of a college lecturer. (You'll soon see that it reflects the utter dedication of such stalwart and indispensable members of society! It also shows that, due to Murphy's law, it's always raining while the lecturer is walking home!)

Figure 8
Look at the labels from an event[guard]/action perspective, and identify for each transition, which of these three elements (event, guard and action) are present/absent. Translate the state diagram into a number of English language statements.
Example 5 - Hegathar's safe in Heligar Castle
A wicked giant named Hegathar lives in Heligar Castle somewhere on the remote island of Nebilafar. He uses a controller for a secret panel in his castle. Behind this panel, Hegathar keeps his valuables, handed down from his great aunt Siborila. To reveal the lock to the safe, he has to remove a particular candle from its holder, but this will reveal the lock only while the safe door is closed. Once Hegathar can see the lock, he can insert his key to open the safe. For extra security he has so arranged things, that he can only open the safe if he replaces the candle first. Now a thief, probably from the neighouring enemy island of Terafabar, will not be aware of this precaution of replacing the candle, and consequently a nasty monster will be released to eat him up for dinner, much to Hegathar's delight.
Draw a state diagram to illustrate this system.
Figure 9
(Sorry I forgot to say that the monster is in fact an enormous rabbit.) The final state (black ringed circle) indicates that the controller object is deleted. It is necessary to put the rabbit back in its cage, mop up the floor, and reboot the system.
Can you think of better names to give the three states?
Answer to the question posed in example 1 - the lifetime of a library book
The diagram below shows the life of a library book, with multiple copies, as it's borrowed and returned. Notice that of all the different values of the number of copies attributes, only two sets are of interest, one being where there are zero copies and the other being where there are non-zero copies. Thus all the non-zero copies states are really just one state from the point of view of the state diagram below.

Figure 10