PiLogger


Welcome to Pilogger... Instead of having multiple different code fragments around the site for datalogging I thought a bit of consolidation was in order. So after a number of very rainy days here is PiLogger.
There are two versions of it for the raspberry pi, one is a console application to do basic logging and the other a more fully featured GUI running in raspbian including basic graphing. Note this was written on a raspberry pi Rev A so I used SMbus 0 that will need to be changed for users of raspberry pi Rev B to SMbus 1.
Both are written in python and can be downloaded here and are open source and provided as is.
If you like it and want to donate please do so here
Console Application
Gui Application
Currently PiLogger supports the LM75 sensor and the type K thermocouple sensor found elsewhere on this site, reading from each sensor is a seperate function so it should also form a basis for adding your own sensor, I'll try and add other sensors as I put them up on the site but let me know of any you write I should include.
PiLogger Gui
In order to run the program save the download into a directory of your choice and navigate to that directory in Lx Terminal.
At the prompt type in
sudo python PiLoggergui.py
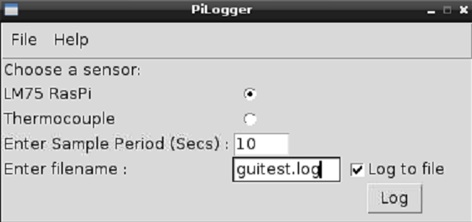
And after a few seconds you should have a window open like the one shown below
Select which sensor we want to use via the radio buttons and enter the sample period in seconds(whole positive integer seconds please..)
If you want to log to file in a csv format type in the filename you wish to save it as andbe sure to tick the log to file tick box.
To begin data logging click on the Log button
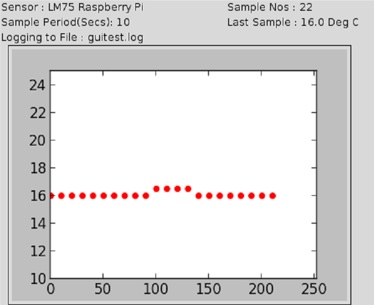
After a little while a screen like the one below should appear and you are logging data.
To exit either go file --> exit or click on the x to close the window
The Console Application
In order to run the application from the terminal program open up an lx terminal window and type
Sudo python Pilogger.py
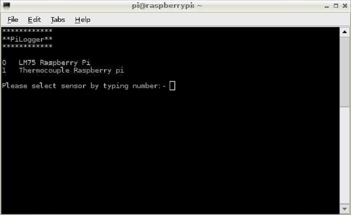
The screen should clear and you be in the first screen
The console application consists of 3 steps
1.Select the sensor we want to use
Screenshot of the sensor selection interface
The sensors list is stored in variable xxxx change this to include new sensors.
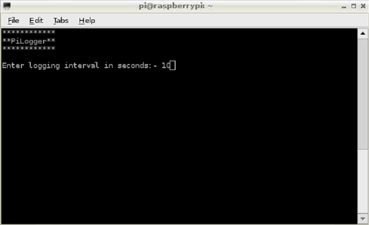
2.Select the Sample period in seconds(Whole seconds only please and positive integers...)
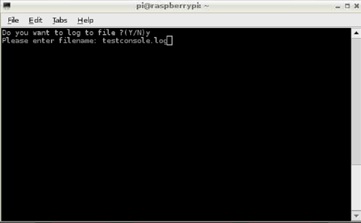
3.Select if you want to log to file
If you choose to log to file enter the filename to log to and the datalog will be stored in a csv format, making it convenient to read into a spreadsheet program for graphing and further analysis.
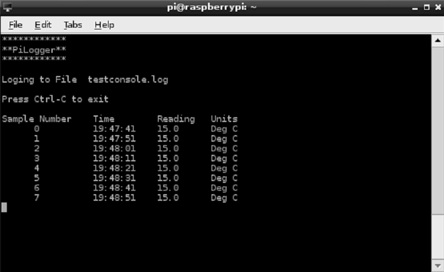
Then the screen should clear and the application should start logging as shown below press ctrl C to exit.
The Code
Below are listings of the code for both applications incase folks want to use various functions in their own projects.
As you'll see I am still learning python so the code is a bit raggedy so constructive remarks would be welcome. Also let me know of any improvements you make and I might incorporate into future versions.
Known Bugs list
1. Pi Gui, transitioning from data input screen to logging screen leaves edit boxes on the screen for a second or two.
If anyone knows how to get rid of these can you drop me a line at hobbyenquires@eircom.net
2.Inverse scaling on Y axis on under temperature
PiLogger Gui Listing
PiLogger Console Listing
Data Logger for the Raspberry Pi