|
ANALYSIS OF NOTAP GAMEPLAY 12/2003 to 01/2001
& ANALYSIS OF NOTAP GAMEPLAY SINCE BHD
|
|||
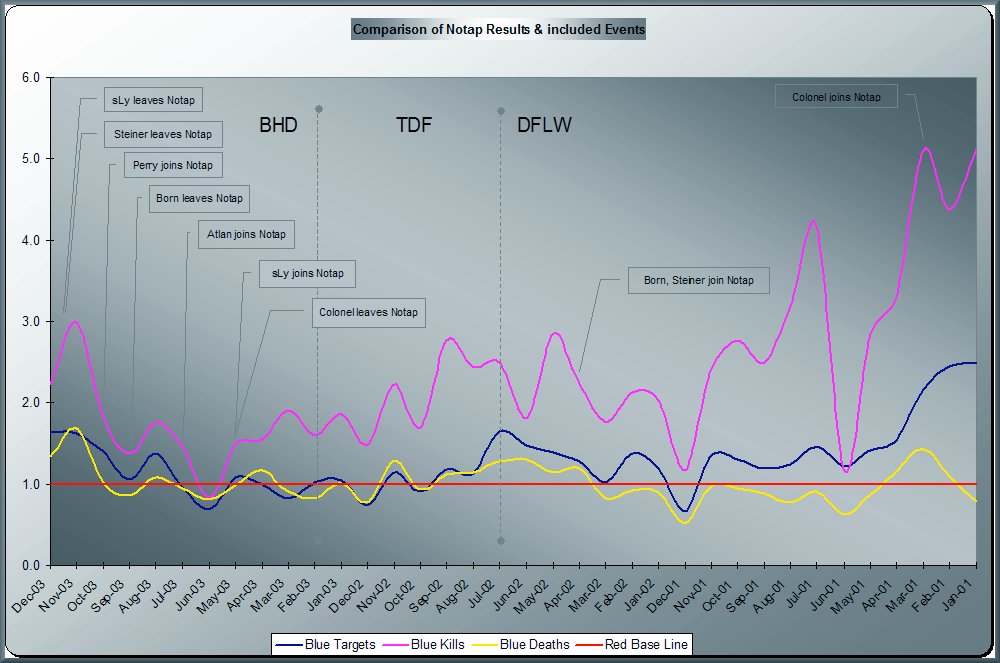
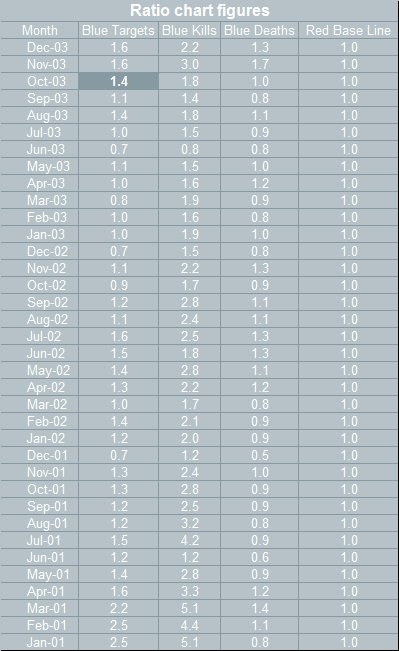
I decided to undertake this analysis primarily for my own interest but feel that it would be useful to both Blue and Red camps to view the results. The results speak for themselves, and I am honestly a little surprised by them myself. But here they are for you to view and make up your own mind. These first results cover all DF games from December 2003 back to January 2001. |
|||
|
Fig 1.
 |
|||
|
|||
|
Fig 3.
|
|||
COMMENT on Fig 3.
|
|||
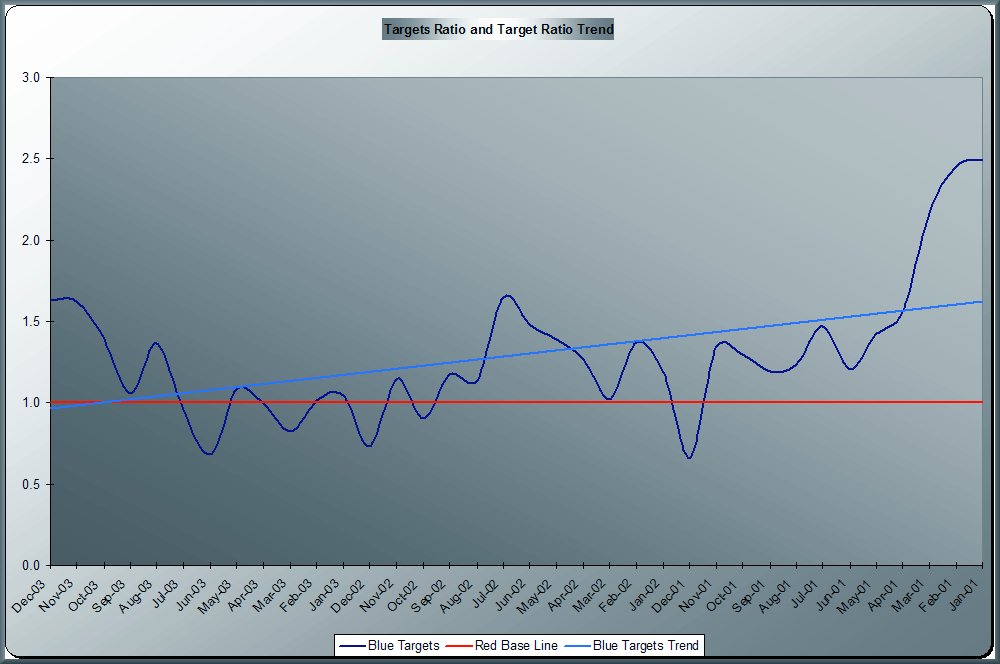
Then I took the same ratio figures and made the following 3 graphs and added a trend line in each to show what they are currently up to. Remember Reds scores are the base line to which these results are judged. Fig 4. displays how they are doing compared to us on targets. |
|||
|
Fig 4.
 |
|||
|
COMMENT on Fig 4.
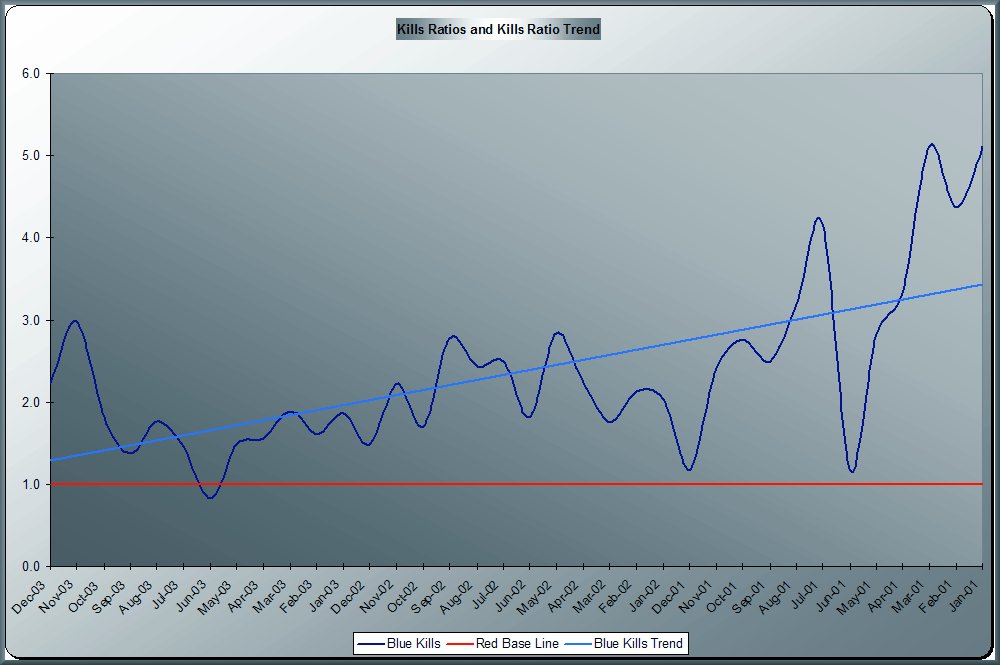
Fig 5. displays how they are doing compared to us on kills. |
|||
Fig 5.
 |
|||
|
COMMENT on Fig 5.
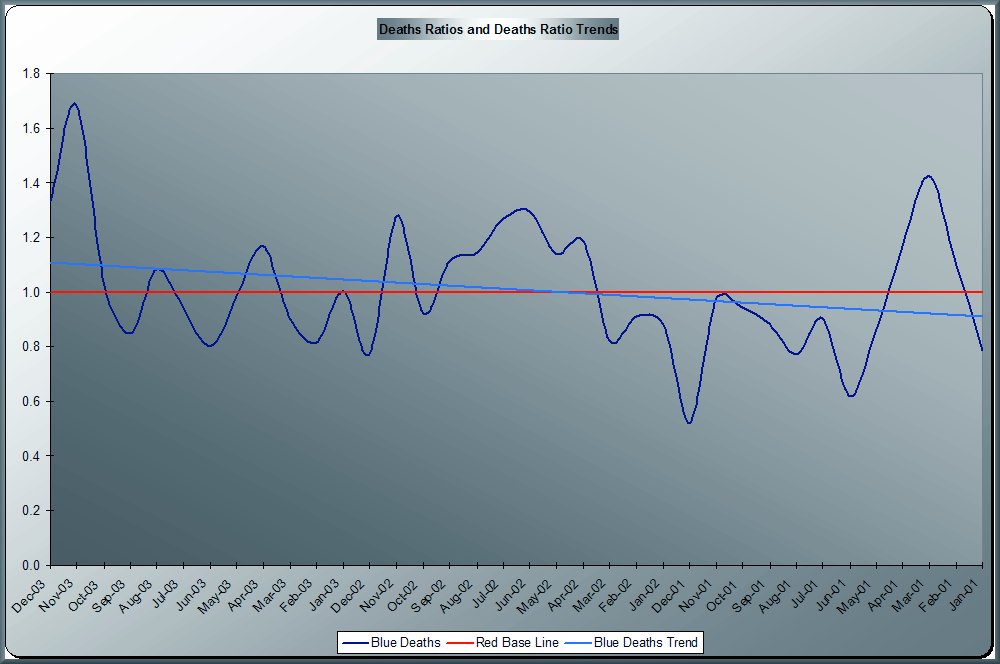
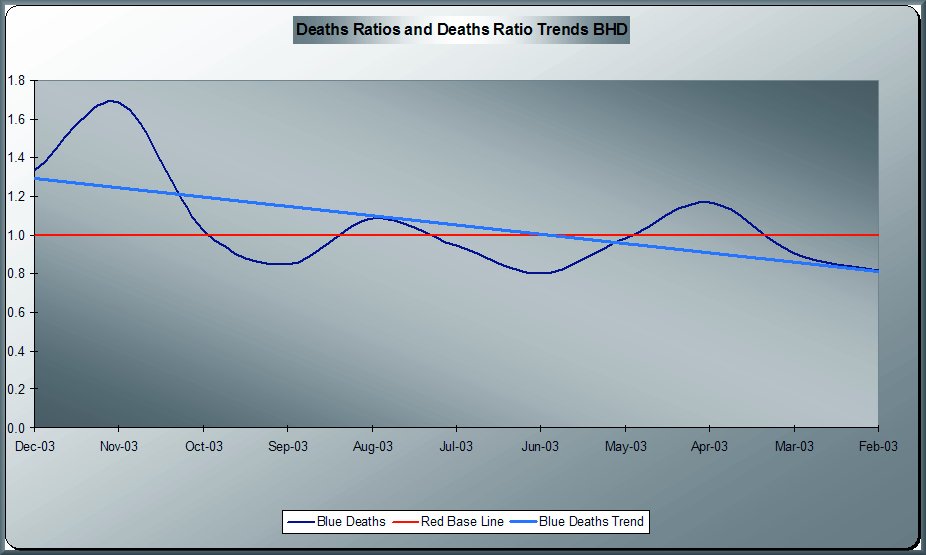
Fig 6. displays how they are doing compared to us on deaths. |
|||
Fig 6.
 |
|||
|
COMMENT on Fig 6.
|
|||
|
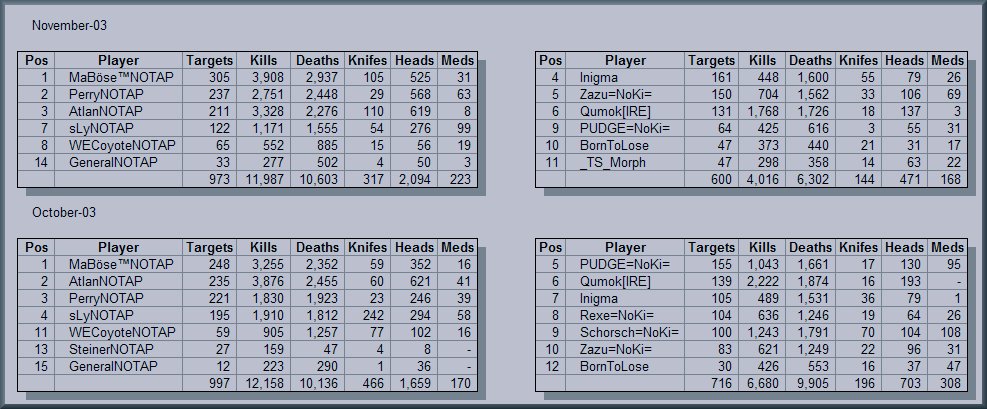
ANALYSIS OF NOTAP GAMEPLAY SINCE BHD
|
|||
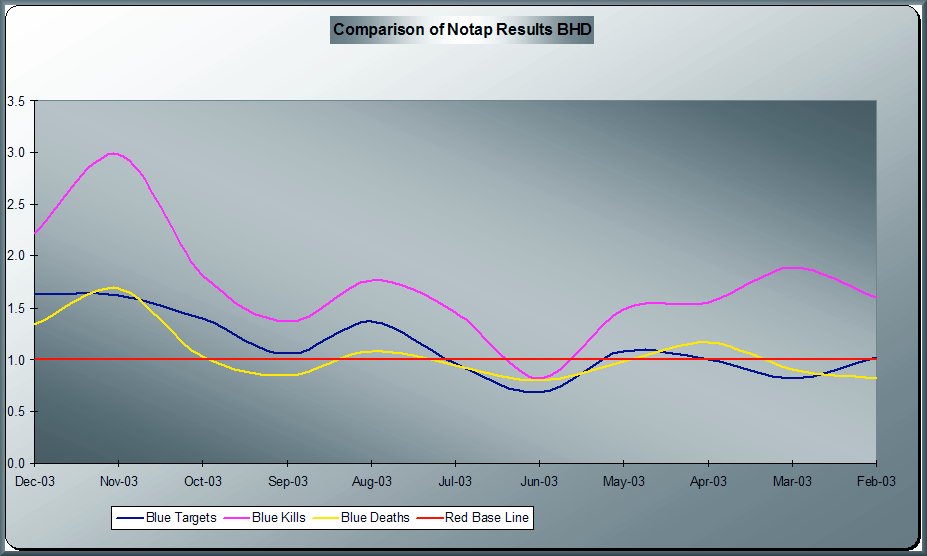
This analysis deals with the recent state of affairs, and seems to differ from the over all trends noted above. These results cover BHD games only from introduction to December 2003. |
|||
|
Fig 7.
|
|||
COMMENT on Fig 7.
|
|||
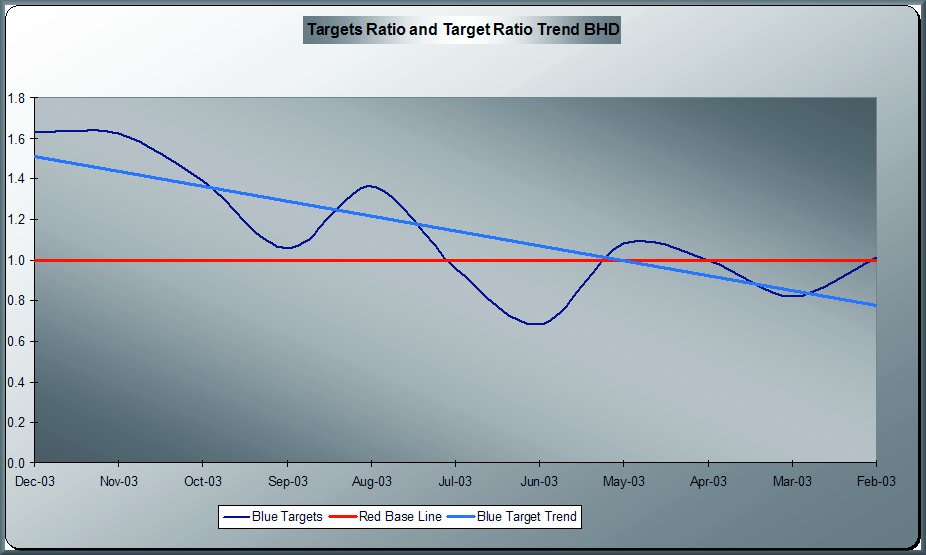
The following graphs break down the results to the individual criteria hopefully allowing a clearer analysis. Fig 8. displays how they are doing compared to us on targets. |
|||
|
Fig 8.
|
|||
|
COMMENT on Fig 8.
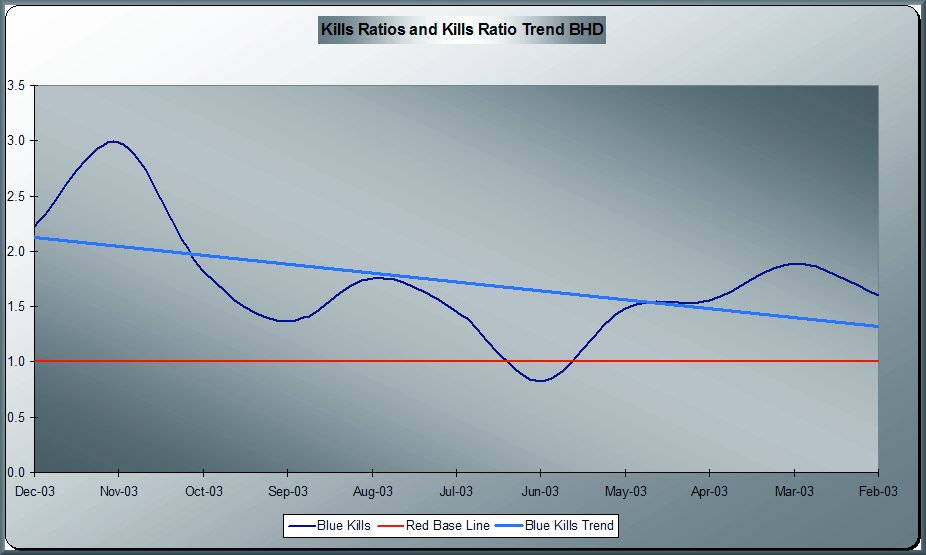
Fig 9. displays how they are doing compared to us on kills. |
|||
Fig 9.
 |
|||
|
COMMENT on Fig 9.
Fig 10. displays how they are doing compared to us on deaths. |
|||
Fig 10.
 |
|||
|
COMMENT on Fig 10.
|
|||
Conclusions: |
|||
|
Because the game versions have changed over time, some areas (like start of 2001) seem to be more extreme in results. It is fair to say that since September 2001, that Notap has been reasonably consistent in its play performance as have Red. However November and (less so) December 2003 show an increase in aggression/map bias. This can be part attributed to the loss of some key squad members and a defensive stance taken by those remaining. Excluding recent events, it seems Notap is not any harder to play than usual. It is not possible to graph the FUN Index, but if Notap keep within the average state of play, idiots like me should be happy enough to continue annoying them by showing up with the Donkey and its load of rockets. I hope the graphs explain a few things to some people, there are days we all get more annoyed than usual at them but they seem to be just days unless I fecked up the data big time! It's not an even playing field, but thats why we stayed while others ran away. I personally would like it a bit more level and doing stuff like this is my attempt to coerce them a little to do that. Please note Notap, this is not an excuse to make things harder, it just shows how things were. Commenting on BHD and current play styles, maybe something's have gone a little wrong. We should ask ourselves what is to be gained from playing a game? It should be a mix of challenge, fun and good old luck and an equal mix of all. Is the purpose of hosting or playing purely to win or to have a good time with your web-mates? For me it has always been the latter. Some of the great and good players along the way who entered the MIA list left because they got pushed too far and lost the fun. It's a hard balancing act to get this right all the time. Notap try to and mostly achieve this - but sometimes the advantage of an outsider is to share the other side of the view. But when the wailing starts its always for a reason. The essence of Notap map for me was challenge not invulnerability. Since I said that, I might as
well voice my disapproval on "Med win only" maps, "out of reach PSP's" and
"unsymmetrical SYM" maps. Fun is not the banned "F" word yet. Anyway Hope its
been insightful to both camps. I will try and keep the analysis going for whatever Nova throw at us
(assuming they allow us to blow things up in the next title Excel sheet containing all data, graphs etc, is available for those willing to give
me cold hard currency (€ only) to make me feel better for wasting 2 days on this stuff in the
first place. A massive thanks must be given to MaBöse and all the Notap squad for their
dedication to taking a bullet in the head and our comments in the neck with much patience (not
always hehe) and grace (Roflmao - just kidding), anyway thanks guys and thanks also to my fellow
Reds, who I know make being part of the Red machine such a pleasure.
Qumok. |
 ).
).