WEB VERSION ONLY
Contact Teagasc HQ,
Sandymount Avenue, Dublin 4, Ireland
for a copy of the printed report
IODINE SUPPLEMENTATION OF CATTLE
End of Project Report:
Project No. 4381 by Philip A.M. Rogers MVB, MRCVS
Grange Research Centre, Dunsany, Co. Meath
4 December 1999
Teagasc acknowledges with gratitude the support of the
European Union Structural Funds (AAGGF)
in financing this research project
SUMMARY AND CONCLUSIONS SUMMARY AND CONCLUSIONS
Ruminant group mineral status on blood test varies widely on commercial farms. This is because of wide variation in dietary mineral input between ruminant groups, and between seasons in the same group of animals.
Ruminants often have nonclinical mineral imbalances, whose correction, by raising or lowering the supply of the relevant minerals, has no detectable benefit on herd health or productivity. However, it is good policy, nationally and in individual herds, to try to keep dietary and blood mineral status in an optimal range. That range is defined as midway between very low and very high values (34). As with other minerals, iodine (I) status varies widely in feed and in animals and nonclinical I deficiency is common. However, I deficiency causes severe problems in some herds and flocks.
Clinical and subclinical I deficiency can have serious effects in affected herds. Effects include 10-60% calf mortality (non-specific abortion, stillbirth, weak calves, neonatal calf deaths); calf thyroid enlargement (also in Se deficiency); retained placenta and infertility (especially suboestrus) in >10% of cows and heifers in affected herds; reduced libido in bulls; lower milk yield in cows; illthrift in calves and yearlings; reduced herd immunity to infections
Diagnosis of I deficiency is based the history, local knowledge, clinical signs and postmortem findings. Diagnosis is confirmed by finding thyroid enlargement, hyperplasia and colloid on histopathology, low levels of I in thyroid tissue, or by low I levels in blood- and/or feed samples. Definitive confirmation is based on a dramatic response to I supplementation of the affected animals. [Thyroid enlargement is not definitive for I deficiency- it can also arise in I toxicity and selenium (Se) deficiency].
Before the advent of the plasma inorganic iodine (PII) test (1) no other test was sensitive- or accurate- enough for routine practical use to assess the I status in farm livestock. Dr. David Poole developed the PII test et Grange for routine use in Ireland. PII proved to be most useful for field investigation of problems in Irish herds and flocks. It is very sensitive to current I intake. After an increase or decrease of I intake, PII rises within hours, and falls within days, respectively. PII can confirm a suspicion of clinical or subclinical I deficiency but needs careful interpretation if generous I supplements were given in the 1-7d before blood sampling.
The National Research Council of the United States of America advises that diets free of I antagonists (goitrogens) need at least 0.4-0.8 mg I/kg dry matter (DM) to maintain normal I status in dairy cows. Goitrogens reduce gastrointestinal absorption and/or thyroid-uptake of I. Synthesis of thyroid hormones is disturbed. In goitrogens are present, dietary I may need to be 2-4 mg/kg DM to maintain normal I status (2).
This report summarises:
|
|
|
|
|
|
|
The data emphasise that PII falls within days after I supplements are removed and that I deficiency is currently the most prevalent trace-element deficiency in Irish cattle and sheep.
The research suggests the need for routine I supplementation of Irish ruminants, especially those at pasture, and at critical times of their annual physiological cycle. The most critical times for cows are from 1 month prepartum to 4 months postpartum, except in herds with unexplained abortions, when supplementation throughout pregnancy may be needed. Also, calves, lambs and growing stock may need regular I supplements if their performance or immunity is compromised by unknown factors.
1. IODINE IN IRISH MINERAL MIXES AND FORAGES
Poole & Rogers (unpublished) found severely low PII levels (<20 ug/L) in many Irish herds in the late 1980s. From 1989 onwards, severe I deficiency was confirmed in herds from many counties, especially in dry cows. Calved cows, fed commercial feeds or mineral mixes high in I, usually had a better I status than dry cows (3). As the inputs of supplementary I from mineral mixtures available on the Irish market, and the I levels in Irish forages on commercial farms were unknown then, it was decided to document them.
1a. I supply from Irish Mineral Mixes in 1989 (4)
Irish or Irish-based suppliers replied to a questionnaire on mineral mixes (including mineral blocks and in-feed mixes) for cattle and sheep. The questions included retail price/tonne, species and type of animals to which the products were to be fed, recommended feeding rate for different types of animals and the mineral and vitamin content of the mixes.
Table 1 summarises the data from 27 sources. Daily I supply between formulations intended for specific types of stock varied widely. The companies were encouraged to formulate mineral mixes to provide 30-60 (preferably 60) mg I/cow/d and pro-rata by body weight for other stock.
1b. Trace element supplements and perinatal calf deaths (5)
In the early 1990s, Dry-Cow Minerals, specifically low in Ca (0%) and high in Mg (15%) and trace elements, especially Cu, Se and I, were formulated and marketed for the first time in Ireland. Co-Op nutritionists and mineral-compounding companies improved the formulations and labelling of many mineral mixes to bring them more in line with Teagasc advice of that time.
Before the advent of Dry-Cow Minerals, individual farmers had reported high levels of perinatal calf mortality (10-40+%). Calves from primiparous heifers are most at risk, as many farmers fail to provide trace element supplements to their in-calf heifers. In 1991 and 1992, producer groups in many areas reported that provision of good quality Dry-Cow Minerals greatly reduced perinatal calf deaths in their herds. Since then, feedback from Teagasc Advisers and from farmers has supported that observation.
Table 2 summarises the levels of I (mg/kg DM) in Irish forages analysed in the Johnstown Castle Laboratories in the period 1990-1993 inclusive. Table 3 summarises the assessment (breakpoint) criteria (mg/kg DM) used to assess the adequacy of I levels in Irish forage as regards suitability for dairy cows, and the % samples in each category in relation to dairy cow requirement. Tables 2 and 3 indicate that the mean I level in Irish forage is grossly deficient for cows; <3% of Irish forages have normal I levels, and most (>97%) have very low or low levels in relation to minimum requirements for cows, even in the absence of goitrogens.
Therefore, unless adequate I supplements are given, one would expect most Irish herds to be low in I status on a blood test for PII.
2. PLASMA INORGANIC IODINE (PII) IN CATTLE, SHEEP AND HORSES
2a. PII in Irish cattle in the 1990s
Through the 1990s, Grange Laboratories monitored the I status of Irish cattle herds and sheep flocks. Table 4 shows the % of cattle herds in each category ranging from very low to very high.
Depending on the year, and in spite of mineral supplementation to many herds, low or very low I status occurred in 32-62% of herds. Also, rather than improving, the herd I status has deteriorated since 1995. As will be seen later, the reason for the high incidence of low I status herds is the very transient effect of I-supplements on PII. This means that most herds and flocks have low PII if an adequate I supplement is not provided at the time of blood sampling.
2b. Diurnal PII pattern after I dosing once/d in cattle (7)
Three steers (196, sd 26.9, kg LW) were given 11 mg I/100 kg LW orally. Blood samples were collected at intervals of 4 h thereafter to determine diurnal variation in PII. Mean PII before dosing was 24, sd 13.5, ug/L. The peak value (140, sd 28.4, ug/L) was observed approximately 8 h after dosing.
2c. PII levels in horses and donkeys
2c.a. PII levels in horses (8)
In 1992, PII was very low in 65% of 17 groups of horses (mainly thoroughbreds) in Kildare, Meath and Tipperary. Only 12% of groups had normal PII levels by bovine standards. The I status of Irish thoroughbreds needs research, especially as regards infertility in mares.
In the trial on PII response in donkeys after I drenching (see 3f, below), donkeys not given an I supplement had very low PII status (mean 5-13 ug/L) relative to normal PII levels in cattle. Whether or not this is common in unsupplemented donkeys in Ireland is unknown.
2d. Relationships between PII, plasma total I (TOTI) and thyroxine in cattle (9)
In the trial PII response in steers to oral I, skin applied I and injection of Lipiodol (3d, below), the relationships between the concentrations of PII (ug/L), plasma total I (TOTI in ug/L) and thyroxine (T4, in nmol/L) were examined in Friesian steers (n=6/treatment). A subset of bloods (n=72) was chosen from the trial to reflect a wide range of PII values. The relationships between PII, TOTI and T4 were:
|
PII = |
0.24*TOTI + 12.7 | (r2=0.51, p <0.01) | |
|
PII = |
-0.85*T4 + 101.2 | (r2=0.05, p > 0.05) | |
|
TOTI = |
-2.08*T4 + 261.4 | (r2=0.04, p > 0.05) |
As PII closely reflects current dietary I intake and blood I status (see most of the trials in this report), the poor relationships between TOTI, T4 and PII confirm that TOTI and T4 are of no practical value in assessing the I status of cattle.
3. METHODS OF IODINE SUPPLEMENTATION
Systems of summer- and winter- management of cattle and sheep vary widely on commercial farms. Thus, Irish farmers need a range of options from which to select the one(s) most suited to their system. The more common options for I supplementation are via the feed, water supply, slow-release bolus, skin application, Lipiodol injection, or by periodic drenching. All of these options were examined under experimental conditions.
3a. I supplementation of cattle via feed
Mineral supplementation via the feed is the cheapest and most effective way to guarantee optimal mineral status in livestock. If animals are fed concentrate rations, whether at a high level indoors in winter, or at a low level as a supplementary summer feed at pasture, the concentrate can be used to carry any mineral, or other, supplements that may be needed.
I supplementation of cows via a mineralised summer dairy nut
Three field studies assessed Co-Op Summer Feeds as vehicles for trace element supplements in 1992-1994.
a. NCF trial 1992 (10)
In 1992, North Connaught Farmers Co-Op (NCF) prepared a Summer Feed containing 360 mg Cu, 3.6 mg Se and 45 mg I in the daily allowance. After circa 4 months, levels of Cu, glutathione peroxidase (GPx) and PII were determined in blood samples from 10 cows/herd in 16 herds fed the NCF summer feed.
Table 5 summarises the results.Compared to other herds in Connaught at the time, NCF herds had a greatly improved Se and I status of dairy cows, but the blood data suggested that better results could be attained if the supply of trace elements were increased.
b. NCF trial 1993 (11)
NCF increased the Cu, Se and I in its Summer Feed, so that the daily allowance (2 kg) supplied 450 mg Cu, 7 mg Se and 60 mg I/cow/d. The status of Cu, Se and I in the blood of 17 herds on the NCF feed for about 4 months was compared with the status for the rest of the country in the same month (August).
Table 6 summarises the results. The 1993 NCF programme was highly successful in maintaining normal blood levels. It gave the best set of blood results from commercial herds ever recorded in this laboratory. Of the herds tested, 100% had normal Cu and Se status. Apart from 15% marginal herds, I status was also normal.
c. Waterford trial 1994 (12)
In 1994, Waterford Co-Op sold a Summer Nut (Gain) with 398 mg Cu, 4.8 mg Se and 43 mg I in the daily allowance. Blood samples for I tests were taken from 10 cows/herd fed on the feed for at least 4 months. Samples were taken also from 10 unsupplemented follower cattle/herd for comparison.
Table 7 summarises the results. The summer feed markedly improved the Cu, Se and I status of supplemented cows, as compared with unsupplemented young stock in the same herds. In the catchment area of the trial, marginal to very low PII (I) status occurred 83.3% of 60 herds, as compared with 100% of 12 other unsupplemented herds (young stock) in the trial and 81.8% of the 11 supplemented cow herds.
Note that the I-supplement increased PII significantly but the mean PII was marginal, as the input of I (43 mg I/cow/d) was below optimum (60 mg I/cow/d).
From these three field studies, feeding of Co-Op Summer Feeds at fixed rates to provide 40-45 mg I/cow/d greatly improved PII status in dairy cows and summer feeds supplying circa 60 mg I/cow/d maintained mean PII levels in the normal range.
I supplementation of beef cows via silage (13)
Earlier work indicated that dairy cows need about 50-60 mg I/cow/d to keep herd mean PII >105 ug/L. In 1994, supplementation of beef cows with 36 mg I/d seemed to keep mean PII >105 ug/L. This suggested that beef cows may have a lower requirement for I than dairy cows. A trial in 1994-95 monitored PII levels in 4 groups of 9 beef cows individually fed a mineral mixture sprinkled over easy-feed silage, to supply 0, 16, 32 or 65 mg I/cow/d before calving. The cows were bled twice pretrial. The mean PII value for each cow was taken as the pretrial (starting) value. On 2/12/94, the cows were allocated to their treatments. On d 34, all supplements were removed. The cows were bled (while off minerals) on d 41 and 48. On d 48, the treatments were changed to 32, 16, 16 and 16 mg I/cow/d respectively. The cows were bled again on d 62, 76, 90 and 104, while still on those treatments. On d 104, the supplement to Gp 0 was reduced to 16 mg I/cow/d, the same as for Gps 1, 2 and 4. On d 124, the cows were bled again and all minerals were withdrawn immediately afterwards. The cows went to grass (between d 131 and 144). A final blood sample was taken on d 165 from unsupplemented cows at pasture. PII was determined on all plasma samples.
Table 8 summarises the results. Mean PII values for sets when I supplement was 0, 16, 32 and 65 mg were 11, 74, 147 and 271 ug/L respectively. The data confirm that beef cows in late pregnancy may need only 30-35 mg I/cow/d to maintain PII >105 ug/L, and that inputs of 65 mg I/cow/d may occasionally increase PII above the upper reference range for normal bovine PII (285 ug/L).
I supplementation of dairy cows via silage (14)
A split-herd, randomised mineral-vitamin supplementation experiment was carried out over two years in a large, trace element deficient dairy herd. Ten weeks before the mean calving date, 147 Holstein-Friesian cows were fed grass silage on to which 50 g/cow of a mineral-vitamin supplement (3000 mg copper, 500 mg iodine, 45 mg selenium and 80 mg cobalt per kg of supplement) was sprinkled twice daily until calving. Mean PII levels before trial were 18.8 ug/L (very low).
Table 9 summarises the PII levels (ug/L, with SD) during the trial. The Dry Cow Mineral supplement significantly increased the concentrations of trace elements, including PII, in the blood of the cows and newborn calves in the supplemented group. It also significantly increased the concentrations of trace elements in the blood and tissues of dead perinatal calves from 10 supplemented dams compared with those from eight unsupplemented dams.
I supplementation of cattle via a molasses-based silage additive (15)
Temol (Premier Molasses, Foynes) is a molasses-based silage additive containing added trace elements. The effectiveness of I supplementation of cattle by the addition of Temol to herbage at ensiling was tested. Temol-treated and control- silage was fed to heifers, with and without additional inorganic mineral mix in concentrates. Temol significantly increased PII in heifers. However, the method needs more research before it can be recommended as national policy.
Oral I supplementation of beef steers (16)
Housed continental steers (n=48, mean circa 500 kg LW) were offered ad-libitum silage + 1.5 kg rolled barley twice/d. No mineral mixture was fed. Mean LW and PII levels in heparinised blood were established for each animal twice pretrial. The overall mean pretrial PII was 20 ug/L (very low). The steers were assigned at random to 8 groups (n=6/group): Gp 1=Untreated controls; Gps 2, 3 and 4=20, 40 and 60 mg I/600 kg LW/d for 30 d; Gps 5, 6 and 7=20, 40 and 60 mg I/600 kg LW/d for 60 d; Gp 8=4 ml Lipiodol, 40% I, injected once. (The Lipiodol results are given separately, see 3e.b, below). The oral I supplement used was a solution of potassium iodide (KI), which contained 2.5 mg I/ml, given at 20, 40 or 60 mg I/600 kg LW/d, representing doses of 33 to 100% of the top dose advised for dairy cows. Half of the dose was sprayed on the concentrates twice/d. After d0, all steers were bled weekly for PII. The steers were bled frequently up to 19-21d after withdrawal of I (d30 in Tr 2-4; d60 in Tr 5-7). Mean values for PII and mean changes from baseline (Subsequent minus Pretrial values) were calculated for each group. The rate of fall of PII after withdrawal of KI was monitored.
Table 10 summarises the results. Control PII values remained very low throughout. As in earlier studies, PII increased as oral I supply increased. In the 30-d trial, relative to PII changes in controls, daily oral supplements of 20, 40 and 60 mg I (as KI)/600 kg LW increased PII (p<.001) by a mean of 94, 180 and 261 ug/L across all samplings while on supplement. On withdrawal of the supplement after 30d, PII fell sharply; by d6 post-withdrawal, the previous level of supplementation had no significant effect on changes from pre-supplementation values. In the 60-dtrial, relative to PII changes in control steers, the supplements increased PII (p<.001) by a mean of 94, 153 and 286 ug/L across all samples. On withdrawal of I supplement after 60d, PII also fell rapidly but took some days longer to reach control levels than in the 30-d trial; by d12-15 post-withdrawal, the previous level of I supply had no significant effect on changes from pre-supplementation values.
In this trial, daily dietary supplements of 20-40 mg I/600 kg LW were optimal for Continental X cattle. These levels are slightly lower than those (30-60 mg I/cow/d) advised for Friesian cows.
Oral I supplementation of beef heifers (17)
Housed continental-cross heifers (n=50, mean circa 518 kg LW) were offered ad-libitum silage + 1.5 kg rolled barley twice/d. A low-I mineral mixture was fed. Mean LW and PII levels in heparinised blood were established for each animal pretrial. The overall mean pretrial PII was 23 ug/L (very low). The animals were assigned to 5 treatment groups (n=10/group): Gp 1=Untreated controls; Gps 2, 3, 4 and 5=oral KI solution sprayed on the on the silage once/d to provide 10, 20, 40 and 60 mg I/600 kg LW/d for 21 d. All animals were bled 4 times for PII while on treatment. Mean values for PII and mean changes from baseline (Subsequent minus Pretrial values) were calculated for each group.
Table 11 summarises the results. Control PII values remained very low (<25 ug/L) to low (<50 ug/L) throughout. As in earlier studies, PII increased as oral I supply increased. Daily oral supplements of 0, 10, 20, 40 and 60 mg I)/600 kg LW increased PII (p<.001) by a mean of 14, 74, 131, 233 and 318 ug/L respectively (sem 25.8).
The data confirm earlier work that suggested that cattle on home-grown forage + unsupplemented meals need a substantial I supplement to maintain PII levels in the normal range. Mean PII increments of 131-233 ug/L from daily oral doses of 20-40 mg I/600 kg LW were enough to maintain PII in the normal range in continental-cross heifers. The data also agree with previous data which suggested that beef-cross cattle may need less I supplement than Friesians.
Oral I supplementation of suckler cows (18)
Suckler cows in late pregnancy were very low in PII on 20/1/94 (mean 23.3 ug/L). From 24/1/94, a mineral mix (nominally 300 mg I/kg) was fed individually to supply a nominal 18 mg I in 60 g/cow/d. By 27/1/94, mean PII had increased by 31 ug/L. Within breed (HerX and ChX), the cows were sorted by PII on 20/1/94 and assigned at random to 4 groups of 6 cows each: control (no I supplement) from 31/1 to 9/2/94; 18 mg I/cow /d; 36 mg I/cow/d; 72 mg I/cow/d, fed individually in a mineral mix sprinkled on the silage once/d. The cows were bled on 27/1, 3/2 and 10/2/94, after which the 18 mg I dose was given to all groups. While on that dose, the cows were bled again on 11/2, 17,2 and 10/3/94.
Table 12 summarises the results. In suckler cows, it seemed that there is a carry-over effect from previous I treatment and that 36-72 mg I/d is enough to maintain PII >100 ug/L.
I supply from foreign Dairy Cow concentrates (19)
To ascertain the daily inputs of minerals and vitamins from foreign dairy concentrates, a questionnaire was sent in 1996 to dairy-feed manufacturers abroad. Minimum, maximum and usual (typical) feeding rates of branded dairy feeds, and the total levels of minerals and vitamins in those feeds were recorded. Three categories of dairy rations were examined: A=Concentrate fed at very high rates (usually >12 kg/cow/d); B=Concentrate fed at medium rates (usually 4-12 kg/cow/d); C=Concentrate to be fed at low rates (usually 1-4 kg/cow/d). Concentrates in category C were usually, but not always, used as summer-feeds at pasture. Thirteen companies in 10 countries (Australia, Belgium, Canada, Denmark, Korea, Republic of China (Taiwan), South Africa, Switzerland, UK and USA) gave useful replies.
Table 13 summarises the results. Mean I inputs used in foreign dairy feeds are much lower than those used in Ireland, and allowed as safe under EU Feed Legislation.
3b. Water delivery systems and I supplementation of cattle via drinking water
3b.1 Accuracy of Dosatron pumps for water medication (20)
To monitor of the effectiveness of pumps to medicate water supplies, delivery of a soluble mineral salt from four Dosatron pumps was tested at dose/water ratio settings of 1.0, 0.78 and 0.39%. At water flow rates of 400-500 l/h, the pumps delivered 2-11% more product than expected at the settings used. At a dose/water ratio setting of 1% (the setting most often used), mean output exceeded specification by 5.8% and the mean range between pumps was 4.6-8.5% above specification. Slow flow rates (80 l/h) tended to increase product output by a further 3-4% units. Slight overdosing is preferable to underdosing.
3b.2. Aquadyne in water: Rate of I release after immersion of tablets (21)
Aquadyne tablets (Mayo Healthcare, Westport) have an insoluble matrix to contain soluble I salts, nominally 420 mg I/tablet respectively. They are used via the trough water supply as I supplements for cattle. They are inserted (1 tablet/7 cows/d) at one end of a simple dispenser immersed in trough-water. As the dispenser becomes full, spent wet tablets are removed from the opposite end. This study monitored:
|
a. |
the I content of fresh Aquadyne tablets |
|
b. |
the DM loss of tablets removed from troughs after up to 15 d immersion in a field-situation |
|
c. |
the DM loss of tablets in a controlled situation and |
|
d. |
the rate of I release from Aquadyne from the tablets over a 7-d period. |
Results:
(a) Fresh tablets contained 98% of the nominal I value.
(b) When converted to KI equivalent of the fresh weight of KI, tablet DM loss over a period of immersion of up to 15 d in a field-situation was 97% of the assayed KI value.
(c) Tablet DM loss in a controlled situation was studied by an adaptation of the nylon-bag technique, as used in rumen-digestibility studies. Air-dry weights of 10 bags were recorded after 1h at 80OC. A tablet was placed in each of the bags. The air-dry weight (after 2h at 80OC) of the bag + tablet was recorded pre-immersion and after 24, 48, 72, 96, 120 and 144 h after immersion in the barrel system, as used in (d), below.
Table 14 summarises the results. Mean tablet DM loss after immersion in water for 24h was 78% of the maximal DM loss, i.e. most of the loss was in d1 and >99% was lost by d5.
(d) Tablet I release rate over 7d was assessed by immersion in a system that mimicked ball-cock controlled troughs in field use. I was assayed in fresh tablets and in tablets removed after periods of immersion of 1, 3, 5, 9 and 24h and at 2, 3, 5 and 7 d (48, 72, 120 and 168h). A total of 60 I tablets (6 fresh, 54 removed from the dispensers at the specified times) were sent for I assay. Each tablet was ground individually and analysed for its total content of I.
Table 15 summarises the results. In basic agreement with DM loss, as found in (3b.2) above, 76% of the I loss occurred within 24 h after immersion in water and >99% was lost by d5.
To ensure regular and even intake of dissolved I by cattle, daily Aquadyne medication of the water is preferable to weekly medication.
3b.3. I supplementation via the water supply for steers
Grange adopts 105-285 ug PII/L as the normal group mean but some authors accept a lower "normal" threshold (>70 ug/L). Early work suggested that Friesian (Fr) cows need 8-10 mg I/100 kg LW/d, orally in, or on, the feed, whereas continental-cross cows and cattle need only 4-6 mg I/100 kg LW/d, to maintain PII in the mid-normal range (125-200 ug/L). The following two experiments assessed the effect of I via the water supply on PII of steers.
Exp. 1 (1990): Flowtrace in the water supply for steers (22)
Grazing Friesian (Fr) steers (5 groups, 12/group, mean 295 kg), were offered for 165d: A KI in a carrier feed to supply 10.4 mg I/100 kg LW/d; B, C, D KI via drinking water at 50, 100 and 150% of dose A, or E no I supplement. Gps B-E also got unmedicated carrier. No other minerals were supplied. Mean PII levels in heparinised blood were very low pretrial (7-8 ug/L).
Table 16 summarises the results. PII stayed very low throughout in the control cattle (Gp E). Relative to control changes, I supplement significantly raised PII levels in a dose-related manner in Gps A-D by 116, 48, 114 and 149 ug/L.
At equivalent I-inputs (Gps A and C), medicated feed or water were equally effective and a dose rate of 10.4 mg I/100 kg LW/d was enough to maintain normal PII levels in Friesian steers (22).
Exp. 2 (1996): Aquadyne in the water supply for steers (23)
In earlier work, Friesian cows and young stock needed an oral supplement of 50-60 mg I/600 kg LW/d to maintain PII in the low-normal to mid-normal range (125-200 ug/L). Continental-cross cows and young stock needed less I (25-35 mg I/600 kg LW/d) to maintain similar PII levels. Those findings spanned a 5-year period, at different times and under different circumstances. Thus, the apparent difference in requirement for I between Friesians and Continental crosses could be due to factors other than breed. The following trial assessed the potential of Aquadyne medication of trough-water (Mayo Healthcare, Westport, 420 mg I/tablet) to control I deficiency in yearling steers at pasture and to examine if there was a breed-effect on the PII response to medicated water.
Two groups of 25 grazing beef cattle, mean 16 months old and 404 kg at the start of the trial, were studied. Each group contained 13-12 Charolais X Friesian (CoX) and 12-13 Friesian (Fr) cattle. Cattle were sorted by LW within type within grazing area. From the sorted list, 4 CoX and 4 Fr cattle/group (total=8 CoX and 8 Fr cattle, mean 404 kg) were selected at random. The 16 selected cattle were colour-tagged and blood sampled at intervals to monitor the PII response to I medication. Each animal was used as its own control. As other trials had indicated that the I requirement of beef cattle may be less that that of dairy cattle, Aquadyne was given at half the recommended dose via the trough-water supply; the trough was medicated with 0.119 Aquadyne tablets/1000 kg LW/d for 14d, starting at 0900h on July 15 (d1) and continuing to 0900h on July 28 (d14) inclusive. This supplied 5 mg I/100 kg LW/d for 14d. Any tablets remaining in the trough were removed at 0900h on July 29 (d15). Blood was taken for PII assay from the 16 cattle twice in the days just before the trial began, and at 0900h on d2, 5, 8, 11, 15, while with access to medicated water, and on d29 and 36 (14 and 21d after the dispenser was removed). Differences in mean PII for the period on treatment versus the periods off treatment (Pre + Post) were calculated and were used to assess the effect of treatment.
Table 17 summarises the results. The data confirmed the sensitivity of PII to current I inputs. Overall mean PII levels pretrial (9.5 ug/L) were very low. The supplement significantly increased PII levels (by a mean of 63 ug/L) but was not enough to normalise PII. The increase due to I medication in Fr cattle (mean 60 ug/L) was not significantly different from that in CoX cattle (mean 67 ug/L). Overall mean post-trial values (16.1 ug/L), though 6.6 ug/L above those pretrial, had fallen to very low levels again at 14 and 21d after withdrawal of I supplement. As in other trials, the beneficial effects of supplementation on PII levels had almost disappeared within 2 weeks. The data suggest that steers need >5 mg I/100 kg LW (close to 10 mg I/100 kg LW) and that breed had no significant effect on PII response (23).
As assessed by PII responses in those two experiments (22, 23), medicated drinking water was an effective I supplement for steers. To keep PII >105 ug/L, both Fr and FrX steers need an I supplement in water of >5 mg I/100 kg LW/d (Exp. 2) to 10.4-15.6 mg I/100 kg LW/d (Exp. 1).
3b.4. Aquadyne in the water supply for suckler cows and calves (24)
The potential of I medication of trough water was assessed as to its ability to control I deficiency (maintain PII in the range 100-300 ug/L) in beef cows and their suckling calves at pasture. Water was medicated with Aquadyne tablets, nominally of 420 mg I each. As other trials had indicated that the I requirement of beef cattle may be less than that of dairy cattle, Aquadyne was given at half the recommended dose via the trough water supply. The water trough available to grazing suckler cows and their calves was medicated with 0.119 tablets/1000 kg LW/d, starting at 0900h on 29/7/96 (d1) and continuing to 0900h on 11/8/96 (d14) inclusive. This supplied 30 mg I/600 kg LW/d for 14d. Any tablets remaining in the trough were removed at 0900h on 12/8/96 (d15). No tablets were removed from the dispenser until it was removed from the trough on d15. Grazing Limousin x Friesian beef suckler cows (n=11) and their 4-month-old calves (n=11), sired by a Charolais or Simmental bull, were bled twice for PII assay before, and at 0900h on d2, 5, 8, 11, 15 (while with access to medicated water), and on d29 and 36 (14 and 21d after the Aquadyne dispenser was removed). Each animal acted as its own control. Differences in mean PII for the period on treatment versus the periods off treatment (Pre + Post) were calculated and were used to assess the effect of treatment.
Table 18 summarises the results. The supplement increased PII levels by a mean of 42 ug/L (p<.001) but was not enough to normalise PII. Mean PII increases in the cows (43 ug/L) and calves (41 ug/L) were not significantly different from each other, suggesting that the calves must have drunk similar amounts of medicated water/kg LW as the cows. The data also confirm the sensitivity of PII to current I inputs. Overall mean PII levels pretrial (cows 5.1, calves 7.0 ug/L) were very low. Overall mean post-trial values (cows 11.1, calves 14.3 ug/L), though 6 to 7 ug/L above those pretrial, had fallen to very low levels again at 14 and 21d after withdrawal of I supplement.
As in other trials, the beneficial effects of supplementation on PII levels had almost disappeared within 2 weeks. The data suggest the need for a dose closer to 60 mg I/600 kg LW if one is to maintain PII in the range accepted as normal.
3b.5. Aquadyne in the water supply for dairy cows (25)
In a randomised controlled trial, Moorepark Holstein cows (568 kg) got 3 treatments (n=10 cows/treatment) over 28d, F (full dose, 1 Aquadyne tablet (420 mg I)/7 cows/d), H (half dose, 1 tablet/14 cows/d), C (unmedicated water). PII was measured twice pre-medication, 4 times (days 7, 14, 21, 28) on medication and twice post-withdrawal of medication (d7 and 14 after removal of I tablets. All 3 groups had very low mean PII (15-20 ug/L) pre-medication. While on medication, mean PII in Gp C stayed very low (16-22 ug/L). PII rose in Gps H and F, to range from 41-72 and 75-103 ug/L, respectively, with large variation within each group. Post-withdrawal of medication, mean PII had returned to pre-medication levels within 7d.
Table 19 summarises the results. Mean PII changes (On-Phase - Off-Phase) in dairy cow Gp C versus Gps H and F (water medication with I tablets to supply 30 or 60 mg I/cow/d) were 0.4, 35.3 and 75.8 (sem 9.5) ug/L, respectively. These means were significantly different at p<.001.
Medication of the trough-water supply with I tablets was an effective I supplement for dairy cows at pasture. The data suggest a water medication dose >60 mg I/cow/d to maintain PII >105 ug/L, or 60 mg/cow/d if a threshold >70 ug/L is acceptable.
3c. I supplementation of cattle via slow-release boluses (26)
Ionox (Animax / Bayer), is the only bolus available commercially for long-term I supplementation for cattle. It is a new slow-release bolus for oral use in cattle, was developed in co-operation with Teagasc, Grange. The bolus was designed to remain in the reticulorumen during its period of trace element release; it contains 3500 mg I, 500 mg Se and 350 mg Co/bolus. Ionox contains no Cu; it has no value as a Cu supplement. Prototypes (Mark 1, 2 and 3), tested between 1993 and 1995, gave encouraging results but the duration of PII elevation after dosing was too short (27, 28, 29). The final version (Mark 4) was released on the Irish market in autumn 1996 and on the UK market in 1997.
Overall, Ionox increased PII levels by (mean+se) 117+10.7 ug/L relative to PII changes in the controls (p<.001).
(c) Ionox Irish ad-hoc observations 1997: Blood from commercial herds assayed at Grange indicated that herds given Ionox 1-3 months before blood test had better PII levels than unsupplemented herds.
Overall, Ionox was an effective slow-release I and Se supplement. Assuming linear release over 28 weeks, mean release would be 18, 2.6 and 1.8 mg I, Se and Co/bolus/d respectively. This should suffice for yearling cattle on pastures that pose a risk of severe deficiency of I, Se or Co. If no other I, Se or Co supplements were given, adult cows would need 2-3 boluses every 5-6 months on similar high-risk pastures (26).
3d. I supplementation of cattle via skin application
PII response in steers to oral and skin applied I (9)
Changes in PII concentration in steers treated with I were examined in Friesian steers (n=6/treatment). In a randomised block experiment, steers were treated with 0 (C), 7 consecutive daily oral doses of 10 mg I/100 kg LW (D), or 70 mg I/100 kg LW applied to the skin of the flank fold on d1 (F). Blood samples were collected before initial treatment and 7 h later on d1, 3, 5 and 7, and once/d at intervals thereafter.
Table 22 summarises the results. Mean PII before initial treatment was <20 ug/L (very low). Mean PII in C (control) remained very low to marginal throughout. Relative to C, peak PII for D occurred 7 h after dosing on d5 and did not differ significantly from C from d12 onwards. Relative to C, peak PII for F occurred 7 h after administration and did not differ significantly from C from d7 onwards. PII increased rapidly after oral- or skin-applied I. Daily oral dosing was more effective in maintaining PII than one skin application.
Since the 1960s, some dairy farmers used to apply 5% tincture of I once/week to the thin skin in the pocket of the flank-fold as an I supplement for cows. The data above confirmed that weekly application of 70 mg I/100 kg LW to the flank fold effectively increases PII in the following week. However, as the handling-facilities on many suckler farms are often poor, that method is not easy to use in suckler cows.
DANI colleagues reported that some farmers in Northern Ireland apply 5% tincture of I weekly as an I supplement to the skin of the back, between the shoulder blades of suckler cows (Maurice McCoy and Frank Malone, personal communication). The method is practical, and the farmers claimed good results. In a simple uncontrolled test, we sprayed a solution of potassium iodide in water between the shoulder blades of a few cattle at Grange; this increased PII markedly. However, further work is needed to establish an optimum dose of KI for that use.
3e. Lipiodol injection as an I supplement for cattle
Injection of Lipiodol (an oil-based, 40% I compound) has been used by some workers to supply I in deficient herds. Two trials were done to assess the effect of Lipiodol on PII in cattle.
a. Lipiodol Trial 1 (9)
Changes in PII concentration were examined in a randomised block experiment in Friesian steers (n=6/treatment) treated with 0 (C), or intramuscular injection (1.1 ml/100 kg LW) of an oil-based I preparation (Lipiodol; 400 mg I/ml)) on d1 (L). Blood samples were collected before initial treatment and 7 h later on d1, 3, 5 and 7, and once/d at intervals thereafter.
Table 23 summarises the results. Mean PII before initial treatment was <20 ug/L (very low). Mean PII in C (control) remained very low to marginal throughout. Lipiodol injection significantly increased PII between d3 and 43, and maintained normal PII between d6 and d36, but the effect was gone by d57 (9).
b. Lipiodol Trial 2 (30)
As part of a larger trial (Oral I supplementation of beef steers, above), housed continental steers (mean circa 500 kg LW) were offered ad-libitum silage + 1.5 kg rolled barley twice/d. No mineral mixture was fed. Mean LW and PII levels in heparinised blood were established for each animal twice pretrial. Overall mean pretrial PII was 20 ug/L (very low). The steers were assigned at random to groups (n=6/group): Gp 1=Untreated controls and Gp 8=4 ml Lipiodol, 40% I in an oil base, injected once.
Table 24 summarises the results. Lipiodol increased PII from d8 to d115 (p<.001) and maintained PII in the marginal or normal range for almost 90d (30).
In some foreign trials, Lipiodol injection of ewes in early pregnancy reduced the incidence of goitrous lambs. However, oil-based products are slow-acting and we are unaware of controlled work published in refereed scientific journals that shows that they prevent neonatal problems in cows. We are also aware of failure of I injection to prevent stillbirth in calves, which was controlled within days by oral I supplements (Rogers & Gately 1992).
After a lag phase of some days (trial 3e.a) Lipiodol significantly increased PII for 42d (trial 3e.a) to 90d (trial 3e.b) after injection in our trials. However it is not registered as a therapeutic agent on the veterinary product list and oral I supplements can maintain normal PII levels for a fraction of its price.
Lipiodol is not recommended as an I-supplement for cows because other methods are effective, faster acting and cheaper.
3f. I supplementation via periodic drenching
PII response in donkeys after drenches of 0.05-0.20 mg I/kg LW (31)
Ten donkeys, penned individually and given 4 kg hay and 0.5 kg barley/d, had very low PII status pretrial. Each was assigned at random to one of 5 treatments (n=2/treatment) X 3 test periods (each of 8d), with cyclic changeover of animals between treatments, after an interval of 21 or 15d respectively from the last dose of the previous period. The treatments were 1=No I (Control); 2=0.05 mg I/kg LW/d; 3=0.10 mg I/kg LW/d; 4=0.15 mg I/kg LW/d; 5=0.20 mg I/kg LW/d. The I dose was drenched orally in 2 equal portions of a solution of potassium iodide, at 0915 and 1615h daily from d0-7 inclusive per period. Indwelling jugular catheters were used to facilitate the collection of blood before the first treatment in each period (d0), at 0, 4, 8, 12, 16 and 20h on d1, 3 times on d2, 4 times on d7, 3 times on d8 and once on d10 and 13 of each period. In all, 500 plasma samples were assayed for PII.
Table 25 summarises the results. PII increased markedly within 24h of oral dosing with I. Mean PII levels attained were dose-related but the law of diminishing returns applied. On withdrawal of I (afternoon of d7), PII fell rapidly, reaching control levels within 6d. PII levels attained during dosing in Gps 2-5 were much lower than levels attained in cattle on similar doses. This suggests that normal PII levels in donkeys may be appreciably lower than in cattle. The lower limit of the normal range for donkeys is placed tentatively at 35 ug/L, the mean attained at a dose rate of 0.05 mg I/kg LW.
PII in steers after an I drench or I by continuous infusion (9)
Eight steers, confirmed to have very low PII status before the trial, were given silage + 3 kg barley/soya mixture in individual stalls. Each steer was assigned at random to one of 4 treatments (n=2 per treatment) X 3 test periods (each of 8d), with cyclic changeover of animals between treatments, after an interval of 21 or 15d respectively from the last dose of the previous period. The treatments were 1=No I (Control); 2=0.10 mg I/kg LW drenched once daily; 3=0.10 mg I/kg LW/d, drenched in two equal portions; 4=0.10 mg I/kg LW/d, infused continuously into the rumen. The I dose was given as a solution of potassium iodide, from d0-7 inclusive/period. Indwelling jugular catheters were used for collection of blood before the first treatment in each period (d0), at 0, 4, 8, 12, 16 and 20h on d1, 3 times on d2, 4 times on d7, 3 times on d8 and once on d10 and 13 of each period, giving 420 plasma samples for analysis.
Table 26 summarises the results. PII increased markedly within 24h of oral drenching with I. Mean PII levels attained by drenching once or twice daily (Gps 2, 3), or by continuous infusion (Gp 4) were similar, except for an unexplained anomaly on d8. On withdrawal of I (afternoon of d7), PII rose (d8) and then fell rapidly, but did not reach control levels by 6d after withdrawal. PII levels attained during dosing in Gps 2-4 were too high on d7 and 8. These levels were higher than levels attained in cows on similar doses, suggesting that an I supplement of 60 mg I/600 kg LW/d (as advised for cows) may be more than steers need.
PII response in sheep after an I drench (32)
Experiments in donkeys and cattle, described above showed that adequate I supplements via the feed, water supply, drenches, or skin-application raise PII within hours. However, on removal of the supplement, PII falls within days and reaches control (untreated) levels within 1-2 weeks. The following experiment confirms the transient effect on PII of an I drench sufficient for 10-20d in lambs.
15 lambs were allocated to 3 groups of 5 each. On 12/6/95 (d0) each lamb was treated as follows: Tr 0=untreated controls; Tr 1=1.02 mg I/kg LW, given as a drench, equivalent to a 10-d supply at the maximum daily dose recommended by Rogers & Gately (1992); Tr 2=double the Tr 1 dose. Heparinised blood was taken pretrial (d0) and on d1, 2, 3, 4, 7 and 14.
Table 27 summarises the results. Confirming data from other species, PII in lambs gave a transient dose-dependent response. It fell to very low levels by d7, even after a drench (Tr 2) that theoretically gave a 20-d (or longer) supply of I.
4. I LEVELS IN SAMPLES OF IRISH BULK-TANK MILK
Low I levels in bovine milk indicate I deficiency in the diet. Carryover of dietary I to milk is variable, but milk I levels increase with intake. High levels in milk may indicate excessive amounts of dietary I, or contamination of milk by I-based teat dips, or disinfectants on the farm, in transit to the milk depot, or during milk processing.
I in cattle feed is mainly iodide, absorbed more or less totally from all levels of the digestive tract. Very little I appears in faeces and that which does is organically bound. Other forms of inorganic I (for example iodates) are reduced to iodide before absorption. Iodinated amino acids are well absorbed as such, though slower than iodide. Ethylene-diamine-dihydro-iodide (EDDI) is very highly absorbed. Recycling (secretion in saliva, gastric juices etc) is a means of conserving I. Urine is the main route of I excretion and increasing levels of I are secreted in milk with increasing inputs of I (Underwood 1962).
However, milk products supply up to 50% or more of human dietary I (as iodide) intake. High I intakes can cause thyrotoxicosis in humans. The threat is greatest to infants fed large amounts of milk powder with excessive levels of I. The American NRC recommends a maximum of 1000 ug I/d as safe for adult humans. From pre-1970 to 1978, milk I levels in American bulk-tanks increased so that a daily intake of 500-1000 ml milk from some farms (1000-2000 ug/L) and 125-500 ml of heavily contaminated milk (2000-8000 ug/L) would exceed the safe human adult dose (Hemken 1979).
There is great variation in the breakpoints used by different authors to assess I status in bovine milk. As an index of bovine I supply, the Grange Labs use:
| MI level (ug/L) |
<25 |
25- 38 |
39- 50 |
51-300 |
301-400 |
>400 |
| MI Status |
Very Low |
Low |
Marginal |
Normal |
High |
Very high |
Between September 1992 and October 1995, 69 samples of milk from farm bulk-tanks were tested for milk I levels. Some samples were grossly deficient in I; others were from herds on an I supplement. The mean milk I value was 139 (range 2-435, sd 108) ug I/L. On average, adults would have to drink >7 l milk/d to exceed the safe level of I from that source. The data indicate no serious national problem with I levels in Irish bulk-tank milk.
Teagasc recommends a maximum supplement of 60 mg I/cow/d but EU Feed Regulations allow up to 165 mg/cow/d. Contamination by I in teat dips and disinfectants, or from excessive use of I supplements in dairy herds, can increase milk I levels. I can also enter milk after the bulk-tank. Non-dietary I (teat dips, disinfectants, post-farm I contamination) is a greater source of I in milk than is dietary I. Hemken (1979) cites several studies that suggest that iodophor use increases mean MI level by 35-390 ug/L between farms or 174-285 ug/L between studies.
On grounds of herd health and human health, there is a case for monitoring larger numbers of bulk-tank samples and, especially, samples of milk at retail sales outlets (33).
5. Overall summary of the dose-response data
In all, mean dose-responses in PII to known input of oral I supplements were available for 28 data sets for cattle.
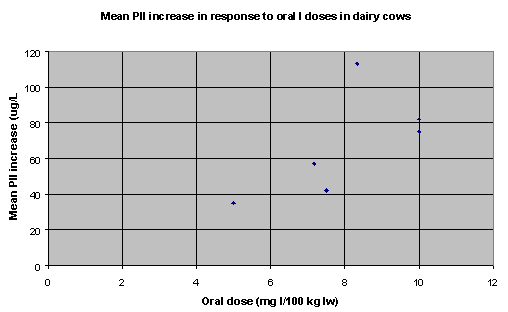
Table 28 summarises the I dose-response data. Figures 1, 2 and 3 summarise the dose-response data graphically (6 data sets for dairy cows, 12 data sets for beef calves, heifers and cows, and 10 data sets for steers).
Figure 1. Dose-response
data for dairy cows (6data sets)
Figure 2. Dose-response data for beef calves,
heifers and cows (12 data sets)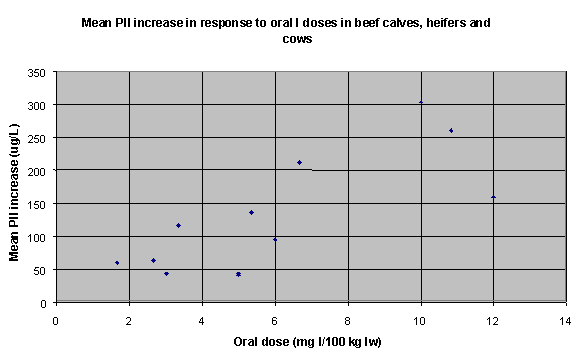
Figure 3. Dose-response data
for steers (10 data sets)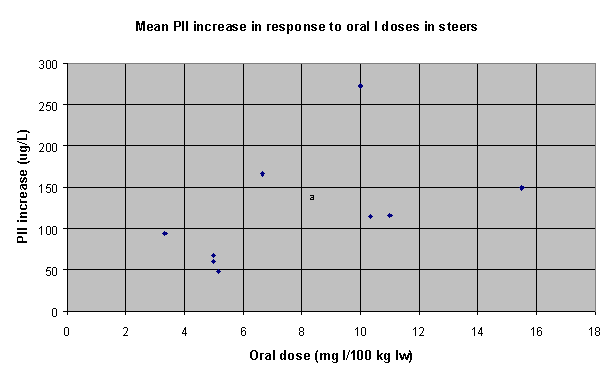
The following table summarises the supplementary I inputs needed to ensure mean PII increases of 100 ug/L above those of unsupplemented control animals:
| Animal type |
Regression (b)
value from all data sets in the equation: |
Supplement (mg I/100 kg LW) needed |
| Dairy cows |
b=8.482 (r2=.414) |
11.79 |
| Beef calves, heifers and cows |
b=21.217 (r2=.188) |
4.71 |
| Steers |
b=15.653 (r2=.588) |
6.39 |
Although the PII response correlated significantly with the I dose, the error of the estimate was wide, especially in the case of the beef calves, heifers and cows (in which the r2 was lowest)
6. Overall conclusions on optimal I supplements from the PII dose-response data
From the data summarised in section 5, above, to maintain PII in the lower end of the normal range, dairy cows need 1.85 times the I supplement of steers/100 kg LW. In turn, steers need 1.36 times that of beef calves, heifers and cows/100 kg LW.
My colleague, Dr. David Poole, started research on I deficiency in cattle in the mid 1980s. After his retirement in 1989, I expanded on his work. I thank him for 25 years of sound guidance and training and for being a most helpful and friendly supervisor and mentor.
Joe Larkin, Liam Moore, Mary Munnelly, Joe Munroe and Noel Tonge (Grange Research Centre) gave skilled technical and/or laboratory help.
Evan Byrne, Garry Fleming, Jim Parle, Willie Murphy, the late Tom Gately and other colleagues in Johnstown Castle Research Centre (Wexford), provided data on Irish forages.
I thank also Drs. Aidan Moloney, Michael Drennan, Gerry Keane, Padraig O'Kiely, Eddie O'Riordan, my research colleagues at Grange, and Drs. John Mee and Kevin O'Farrell, Moorepark, for their co-operation in specific trials on dose-responses to I.
Thanks also to Preference Products (now NutriBio), Cork for cooperation in the work on trace element medication of drinking water; Animax and Bayer, UK for cooperation in the Ionox research; Mayo HealthCare for cooperation in the work on Aquadyne, and Premier Molasses, Foynes, for co-operation in the work on Temol.
Table 1. Mean I (mg/head/d) supplied in Irish mineral mixes in 1989. The data were calculated from questionnaire replies from 27 sources.
|
Cows various |
Suckler |
Dairy |
Cows prepartum |
Cows postpartum |
|
34 |
32 |
44 |
38 |
44 |
|
Cows in tetany season |
Adults & finishing cattle |
Yearlings |
Weanlings |
Sheep |
|
39 |
30 |
23 |
18 |
5.2 |
|
Ewes |
Ewes Prepartum |
Ewes Postpartum |
Ewes in Tetany season |
Lambs |
|
5.6 |
5.3 |
8 |
5.7 |
3.9 |
Table 2. Levels of I (mg/kg DM) in Irish forages analysed at Johnstown Castle in 1990-1993 inclusive.
|
Herbage |
Grass silage |
Hay* |
|||||||||||||||||||||||||||||
|
90 |
91 |
92 |
93 |
All |
90 |
91 |
92 |
93 |
All |
90 |
91 |
92 |
93 |
All |
|||||||||||||||||
| X |
0.224 |
0.270 |
0.321 |
0.378 |
0.261 |
0.252 |
0.275 |
0.355 |
0.330 |
0.269 |
0.310 |
- |
0.200 |
0.195 |
0.225 |
||||||||||||||||
| n |
240 |
460 |
73 |
4 |
777 |
344 |
231 |
36 |
16 |
627 |
1 |
- |
1 |
2 |
4 |
||||||||||||||||
| sd |
0.168 |
0.172 |
0.238 |
0.134 |
0.182 |
0.172 |
0.168 |
0.236 |
0.189 |
0.177 |
- |
- |
- |
0.055 |
|||||||||||||||||
| se |
0.011 |
0.008 |
0.028 |
0.067 |
0.007 |
0.009 |
0.011 |
0.039 |
0.047 |
0.007 |
- |
- |
- |
0.028 |
|||||||||||||||||
| Min |
0.05 |
0.04 |
0.16 |
||||||||||||||||||||||||||||
| Max |
1.00 |
0.98 |
0.31 |
||||||||||||||||||||||||||||
* Irish farmers make relatively little hay because of the instability of our weather and its effects on hay-quality.
Table 3. Assessment criteria (mg I/kg DM) and the % forage samples in each category in relation to dairy cow requirement for I. Note: Even in the absence of goitrogens, 97-100% of Irish forages have insufficient I for dairy cows.
|
Very low |
Low* |
Normal |
High |
|
| Assessment breakpoints |
< .2 |
(.2-.4, .4-.8) |
>.80 |
- |
|
% Herbage samples |
46.6 |
(38.1, 12.4) |
2.9 |
0 |
|
% Grass silage samples |
42.7 |
(38.6, 16.9) |
1.8 |
0 |
|
% Hay samples** |
25.0 |
(75.0, 0.0) |
0 |
0 |
* Forage I levels >0.30
mg/kg DM usually indicate sample contamination with soil.
** Because of the instability inherent in Irish weather, hay is
made with decreasing frequency.
Table 4. Percentage of Irish herds with mean PII in various categories (VL=very low; LO=low; ML=marginal; NL=normal; HI=high).
|
Yr |
(n) herds |
%VL |
%LO |
%VL+LO |
%ML |
%NL |
%HI |
|
91 |
642 |
33.00 |
24.60 |
57.60 |
15.70 |
23.70 |
3.00 |
|
92 |
1068 |
38.10 |
24.30 |
62.40 |
22.10 |
14.30 |
1.20 |
|
93 |
1158 |
32.90 |
24.50 |
57.40 |
22.80 |
17.40 |
2.30 |
|
94 |
1190 |
18.40 |
19.70 |
38.10 |
25.60 |
31.70 |
4.60 |
|
95 |
900 |
14.60 |
17.60 |
32.10 |
23.70 |
39.00 |
5.20 |
|
96 |
755 |
18.70 |
17.70 |
36.40 |
22.40 |
35.50 |
5.70 |
|
97 |
455 |
28.10 |
15.20 |
43.30 |
25.70 |
28.10 |
2.90 |
|
*98 |
** |
35.29 |
15.05 |
50.34 |
18.14 |
22.75 |
8.77 |
* The data for 1998 are
estimates only
**The 1998 estimates are based on PII in 7861 individual blood
samples, excluding samples taken in connection with the abattoir survey of trace
element status in cattle. Those data will be reported elsewhere; they show that
>80% of cattle (culled dairy cows, culled suckler cows and finished cattle)
slaughtered in autumn have low I status.
Table 5. For details of the trial, see NCF trial 1992, above. Mean Cu (umol/L), GPx (iu/g Hb) and PII (ug/L) in the NCF herds versus other Connaught herds.
|
Cu ( n) |
GPx ( n) |
PII ( n) |
|
|
NCF Herds |
#11.37 (16) |
64.6 (16) |
100.5 (16) |
|
Other Herds |
#11.62 (29) |
51.1 (31) |
58.4 (21) |
|
Sig. |
ns |
* |
*** |
# Mean blood Cu was normal in both groups
Table 6. Mean and se for Cu (umol/L), GPx (iu/g Hb) and PII (ug/L) in the 1993 NCF herds versus other Connaught herds.
|
Cu umol/L |
GPx iu/g Hb |
PII ug/L |
||
|
NCF herds |
n |
17 |
17 |
17 |
|
Other herds |
n |
55 |
53 |
63 |
|
NCF herds |
X |
11.85 |
89.2 |
125.3 |
|
Other herds |
X |
11.37 |
55.4 |
43.2 |
|
NCF herds |
se |
0.148 |
2.025 |
11.642 |
|
Other herds |
se |
0.247 |
2.558 |
4.460 |
|
Difference |
Sig. |
* |
*** |
*** |
Table 7. For details of the trial, see Waterford trial 1994, above. Mean and se for Cu (umol/L), GPx (iu/g Hb) and PII (ug/L) in the Waterford Gain herds versus control herds in the catchment. Note that the I-supplement increased PII significantly but the mean PII was marginal, as the input of I (43 mg I/cow/d) was below optimum (60 mg I/cow/d).
|
Cu umol/L |
GPx iu/g Hb |
PII ug/L |
||
|
Treated Herds |
X |
12.52 |
96.77 |
79.28 |
|
se |
0.20 |
2.59 |
5.17 |
|
|
Control Herds |
X |
11.27 |
43.58 |
22.08 |
|
se |
0.28 |
1.79 |
2.67 |
|
|
Sig. |
*** |
*** |
*** |
Table 8. For details of the trial, see I supplementation of beef cows via silage, above. Treatment means for PII (ug/L) in beef suckler cows pretrial and up to 165 d after the start of the trial.
|
TR |
d0 |
d13 |
d34 |
d41 |
d48 |
d62 |
d76 |
d90 |
d104 |
d124 |
d165 |
|
0 |
8.7 |
11.1 |
8.1 |
8.6 |
8.0 |
120.0 |
166.2 |
137.4 |
138.1 |
69.8 |
12.1 |
|
1 |
8.3 |
102.9 |
56.4 |
11.6 |
12.2 |
61.8 |
79.7 |
66.4 |
83.0 |
50.2 |
11.7 |
|
2 |
9.6 |
203.1 |
114.6 |
14.3 |
13.9 |
82.7 |
92.1 |
73.9 |
105.7 |
57.0 |
14.0 |
|
4 |
7.0 |
375.0 |
166.8 |
19.1 |
11.4 |
64.1 |
77.0 |
65.0 |
78.7 |
61.3 |
13.2 |
Underlined means were for dates when no supplement was given. Italicised means were for dates when 32 mg I was being fed. Bold means were for dates when 65 mg I was being fed. All other means were for dates when 16 mg I was being fed.
Table 9. For details of the trial, see I supplementation of dairy cows via silage, above. Mean PII levels (ug/L, with SD) in dairy cows at 2 to 15 weeks after treated cows had access to silage treated with a Dry-Cow Mineral. Mean PII levels (all cows) before the trial were 18.8 ug/L (very low). Levels remained very low in the control cows but were normal at all samplings in the treated cows.
|
Week after start of trial |
2 |
5 |
10 |
15 |
|
Treated cows |
145.0 (52.0) |
106.7 (37.0) |
121.5 (42.2) |
133.9 (49.4) |
|
Control cows |
13.4 (5.3) |
8.7 (4.7) |
14.4 (9.7) |
18.6 (25.2) |
|
Significance of difference |
* |
* |
* |
* |
Table 10. For details of the trial, see oral I supplementation of beef steers, above. Mean blood PII (ug/L) pretrial, during trial and post-withdrawal (- prefix) of an oral I supplement (Gps 1, 2, 3 and 4) and changes from baseline values.
|
Gp |
Pre |
8 |
15 |
22 |
29 |
-3 |
-6 |
-9 |
-12 |
-15 |
-18 |
-21 |
|
1 |
20 |
19 |
20 |
13 |
10 |
10 |
8 |
9 |
7 |
6 |
6 |
3 |
|
2 |
20 |
102 |
117 |
125 |
81 |
39 |
14 |
22 |
11 |
8 |
11 |
7 |
|
3 |
21 |
228 |
198 |
208 |
138 |
60 |
18 |
22 |
13 |
7 |
14 |
6 |
|
4 |
19 |
295 |
240 |
343 |
212 |
86 |
23 |
20 |
12 |
12 |
13 |
6 |
|
sem |
3.29 |
21.8 |
24.6 |
28.5 |
22.6 |
8.45 |
2.82 |
1.68 |
0.85 |
1.29 |
0.98 |
1.04 |
|
Pr<F |
ns |
*** |
*** |
*** |
*** |
*** |
* |
*** |
** |
* |
*** |
ns |
Changes from baseline values to the days shown were:
|
Gp |
- |
8 |
15 |
22 |
29 |
-3 |
-6 |
-9 |
-12 |
-15 |
-18 |
-21 |
|
1 |
- |
-2 |
0 |
-7 |
-10 |
-10 |
-12 |
-11 |
-13 |
-14 |
-14 |
-17 |
|
2 |
- |
82 |
97 |
105 |
61 |
19 |
-6 |
2 |
-10 |
-13 |
-9 |
-13 |
|
3 |
- |
207 |
176 |
187 |
117 |
39 |
-4 |
1 |
-9 |
-14 |
-8 |
-15 |
|
4 |
- |
276 |
220 |
324 |
193 |
67 |
-4 |
1 |
-8 |
-7 |
-6 |
-13 |
|
sem |
- |
22.2 |
24.2 |
28.7 |
23.2 |
9.1 |
3.94 |
3.66 |
3.26 |
3.42 |
3.53 |
3.37 |
|
Pr<F |
- |
*** |
*** |
*** |
*** |
*** |
ns |
ns |
ns |
ns |
ns |
ns |
Mean blood PII (ug/L) pretrial, during trial and post-withdrawal(- prefix) of supplement (Gps 1, 5, 6 and 7 only) and changes from baseline values were:
|
Gp |
Pre |
8 |
15 |
22 |
29 |
36 |
43 |
50 |
57 |
-3 |
-6 |
-9 |
-12 |
-15 |
-19 |
|
|
1 |
20 |
19 |
20 |
13 |
10 |
10 |
7 |
5 |
8 |
16 |
11 |
12 |
12 |
12 |
9 |
|
|
5 |
19 |
112 |
120 |
103 |
85 |
130 |
89 |
98 |
103 |
99 |
37 |
29 |
19 |
14 |
9 |
|
|
6 |
19 |
213 |
136 |
199 |
127 |
217 |
127 |
142 |
147 |
151 |
48 |
36 |
19 |
15 |
10 |
|
|
7 |
18 |
315 |
270 |
385 |
218 |
373 |
210 |
273 |
326 |
257 |
92 |
42 |
25 |
18 |
11 |
|
|
sem |
3.18 |
16.4 |
19.7 |
26.3 |
15.7 |
20.0 |
8.6 |
15.5 |
15.4 |
16.0 |
8.2 |
3.1 |
1.4 |
1.1 |
0.7 |
|
|
Pr<F |
ns |
*** |
*** |
*** |
*** |
*** |
*** |
*** |
*** |
*** |
*** |
*** |
*** |
** |
ns |
|
Changes from baseline values to the days shown:
|
Gp |
- |
8 |
15 |
22 |
29 |
36 |
43 |
50 |
57 |
-3 |
-6 |
-9 |
-12 |
-15 |
-19 |
|
|
1 |
- |
-1 |
0 |
-7 |
-10 |
-10 |
-13 |
-15 |
-12 |
-5 |
-10 |
-9 |
-9 |
-8 |
-11 |
|
|
5 |
- |
93 |
101 |
84 |
66 |
111 |
70 |
79 |
84 |
80 |
18 |
10 |
8 |
-5 |
-10 |
|
|
6 |
- |
194 |
117 |
180 |
108 |
198 |
108 |
123 |
128 |
132 |
29 |
17 |
0 |
-4 |
-9 |
|
|
7 |
- |
297 |
252 |
367 |
200 |
354 |
192 |
255 |
308 |
239 |
73 |
24 |
7 |
0 |
-8 |
|
|
sem |
- |
16.6 |
19.3 |
25.2 |
15.8 |
19.4 |
7.8 |
16.8 |
15.7 |
16.4 |
8.7 |
4.9 |
3.3 |
2.9 |
3.3 |
|
|
Pr<F |
- |
*** |
*** |
*** |
*** |
*** |
*** |
*** |
*** |
** |
*** |
*** |
* |
ns |
ns |
|
Table 11. For details of the trial, see oral I supplementation of beef heifers, above. Mean blood PII (ug/L) pretrial, during oral I supplementation, change at from baseline at S1 to S4 (I1 to I4), overall mean on treatment, and mean effect of treatment.
|
Tr |
Pre |
S1 |
S2 |
S3 |
S4 |
I1 |
I2 |
I3 |
I4 |
On Trial# |
Gross Effect~ |
Net Effect! |
|
1 |
23.3 |
38.5 |
48.1 |
30.6 |
33.6 |
15.2 |
24.8 |
7.3 |
10.3 |
37.7 |
14.4 |
0.0 |
|
2 |
21.5 |
90.9 |
114.6 |
88.5 |
89.1 |
69.4 |
93.1 |
67.0 |
67.6 |
95.8 |
74.3 |
59.9 |
|
3 |
24.0 |
142.3 |
177.4 |
152.9 |
148.6 |
118.3 |
153.4 |
128.9 |
124.6 |
155.3 |
131.3 |
116.9 |
|
4 |
23.0 |
235.3 |
246.4 |
271.1 |
272.1 |
212.3 |
223.4 |
248.1 |
249.1 |
256.2 |
233.2 |
211.8 |
|
5 |
21.5 |
341.7 |
289.2 |
376.8 |
351.9 |
320.2 |
267.7 |
355.3 |
330.4 |
339.9 |
318.4 |
304.0 |
|
sed |
1.5 |
24.4 |
11.8 |
25.1 |
19.1 |
24.3 |
11.4 |
24.8 |
18.7 |
16.7 |
16.3 |
16.3 |
|
Sig |
ns |
*** |
*** |
*** |
*** |
*** |
*** |
*** |
*** |
*** |
*** |
*** |
# Mean PII on trial was based on the mean value
of 4 blood-samplings (S1 to S4) during the 21-d trial period.
~ The mean effect was based on [(the mean
"On Trial" value) minus (the Pre value)]
! The mean net effect was based on [(the mean
"On Trial" value) minus (the Pre value) minus the change in the
untreated controls (Gp 1)]
Table 12. For details of the trial, see Oral supplementation of suckler cows with I, above. Treatment mean PII levels (ug/L) in suckler cows on or off an oral supplement of 0, 18, 36 or 72 mg I/cow/d.
|
Tr Gp |
20/1 (Pre) |
27/1 |
3/2 |
10/2 |
11/2 |
17/2 |
10/3 |
|
1 |
#21.2 |
*54.0 |
#16.3 |
#13.3 |
*34.7 |
*58.0 |
*63.7 |
|
2 |
#26.0 |
*58.2 |
*77.0 |
*67.5 |
*80.8 |
*75.8 |
*78.8 |
|
3 |
#23.3 |
*55.7 |
**126.2 |
**103.5 |
*112.7 |
*78.8 |
*90.0 |
|
4 |
#22.8 |
*50.0 |
***172.3 |
***187.5 |
*153.0 |
*85.8 |
*97.2 |
The I doses were #0, *18, **36, or ***72 mg/cow/d
Table 13. Foreign manufacturers' mean recommended feeding rates, and the I specification of the dairy feeds in categories (Cat) A, B and C.
|
Cat |
Minimum (kg/cow/d) |
Maximum (kg/cow/d) |
Usual (kg/cow/d) |
I level (mg/kg) |
I supply (mg/cow/d) |
|
A |
12.5 |
16.9 |
15.1 |
0.7 |
11.0* |
|
B |
3.6 |
8.6 |
5.9 |
2.2 |
12.1* |
|
C |
1.9 |
4.4 |
2.9 |
5.3 |
10.2* |
*Mean daily I supply masks variation between countries, between companies and, even inputs between different rations formulated by the same company, and between feeding rates advised by the company.
Table 14. For details of the trial, see Aquadyne in water: Rate of I release after immersion of tablets, above. Tablet DM loss (g) and % of active ingredient lost after immersion of Aquadyne tablets for 0-144h.
|
0 |
24h |
48h |
72h |
96h |
120h |
144h |
|
| X |
0 |
0.408 |
0.490 |
0.512 |
0.512 |
0.519 |
0.52 |
| Sd |
0 |
0.039 |
0.053 |
0.054 |
0.054 |
0.050 |
0.052 |
| Loss/total loss % |
0 |
78.5 |
94.2 |
98.5 |
98.5 |
99.8 |
100 |
Table 15. For details of the trial, see Aquadyne in water: Rate of I release after immersion of tablets, above. I loss (mg) and % of total I lost after immersion of Aquadyne tablets for 0-168h.
|
0h |
1h |
3h |
5h |
9h |
24h |
48h |
72h |
120h |
168h |
|
|
Mg active element |
410.82 |
325.48 |
261.7 |
242.25 |
204.27 |
99.1 |
26.1 |
6.15 |
0.28 |
0.05 |
|
sd |
0.25 |
23.65 |
33.14 |
19.36 |
24.82 |
10.55 |
6.59 |
3.43 |
0.16 |
0.05 |
|
% loss of total I |
0 |
20.77 |
36.30 |
41.03 |
50.28 |
75.88 |
93.65 |
98.5 |
99.93 |
99.99 |
Table 16. For details of the trial, see Exp. 1 (1990): Flowtrace in the water supply for steers, above. Mean PII levels in steers on oral I supplements (A) of 10.4 mg I/100 kg LW/d in a carrier feed, and (B, C, D, E) 5.2, 10.4, 15.6 and 0 mg I/100 kg LW/d via drinking water.
|
Tr |
Pre |
30/5 |
18/7 |
30/10 |
On trial |
Net Change (On trial - Pre) |
Net Effect |
|
A |
7.9 |
158.1 |
156.3 |
55.3 |
123.2 |
115.3 |
115.8 |
|
B |
7.2 |
39.9 |
65.8 |
59.0 |
54.9 |
47.7 |
48.2 |
|
C |
7.4 |
96.5 |
176.3 |
88.5 |
120.4 |
113.0 |
113.5 |
|
D |
6.7 |
127.2 |
213.0 |
125.3 |
155.2 |
148.5 |
149.0 |
|
E |
6.9 |
5.6 |
5.3 |
8.3 |
6.4 |
-0.5 |
0.0 |
|
Sig. |
ns |
*** |
*** |
*** |
*** |
*** |
*** |
Table 17. For details of the trial, see Exp. 2 (1990): Flowtrace in the water supply for steers, above. Mean PII levels (ug/L) in continental-cross (CoX) steers (n=8) and Friesian (Fr) steers (n=8) before, during (d1-d14) and after (d-14 and d-21) I supplementation with Aquadyne via the water supply.
|
Breed |
Pre |
d1 |
d4 |
d7 |
d10 |
d14 |
d-14 |
d-21 |
Post |
Off |
On |
Effect |
|
|
CoX |
X |
9.7 |
21 |
88.5 |
105.5 |
119.9 |
65.6 |
17.5 |
17.0 |
17.3 |
13.5 |
80.1 |
66.6 |
|
Fr |
X |
9.3 |
22.5 |
90.6 |
91.0 |
104.6 |
49.8 |
14.9 |
15.0 |
14.9 |
12.1 |
71.7 |
59.6 |
|
sem |
0.8 |
3.16 |
19.5 |
32.8 |
25.8 |
15.0 |
1.8 |
1.04 |
0.83 |
0.53 |
13.5 |
13.9 |
|
|
Sig |
ns |
ns |
ns |
ns |
ns |
ns |
ns |
ns |
** |
** |
ns |
ns |
Table 18. For details of the trial, see Aquadyne in the water supply for suckler cows and calves, above. Mean PII levels (ug/L) in suckler cows (n=11) and calves (n=11) before, during and after I supplementation with Aquadyne via the water supply.
|
Pre |
d1 |
d4 |
d7 |
d10 |
d14 |
d-14 |
d-21 |
Post |
Off |
On |
Effect |
|
|
Cows X |
5.1 |
13.1 |
46.1 |
69.5 |
50.1 |
74.3 |
15.0 |
7.1 |
11.1 |
8.1 |
50.6 |
42.5 |
|
se |
0.41 |
0.65 |
3.03 |
4.94 |
8.01 |
5.15 |
0.90 |
0.77 |
0.67 |
0.46 |
3.68 |
3.41 |
|
Calves X |
7.0 |
14.5 |
41.3 |
69.1 |
51.4 |
79.2 |
18.9 |
9.6 |
14.3 |
10.6 |
51.1 |
40.5 |
|
se |
0.6 |
1.3 |
7.3 |
9.8 |
12.6 |
12.6 |
1.6 |
0.9 |
1.2 |
0.8 |
8.2 |
8.0 |
| Sem |
0.74 |
1.42 |
7.94 |
11.00 |
15.00 |
13.60 |
1.81 |
1.17 |
1.36 |
0.95 |
9.02 |
8.69 |
| Sig |
** |
ns |
ns |
ns |
ns |
ns |
* |
* |
* |
** |
ns |
ns |
Table 19. For details of the trial, see Aquadyne in the water supply for dairy cows, above. Mean PII se and sem (ug/L) for dairy cows pre-, during (d7 to d28) and post- (d-7 and d-14) supplementation with Aquadyne tablets, supplying 0, 30 and 60 mg I/600 kg LW/d (treatments C, H and F, respectively) via drinking water. (***=significant at p<.001).
|
TR |
Pre |
d7 |
d14 |
d21 |
d28 |
d-7 |
d-14 |
Effect (On-Off) |
|||
|
C |
X |
19.75 |
20 |
22 |
17.1 |
16.4 |
17.4 |
17 |
0.4 |
||
|
se |
1.75 |
1.74 |
2.81 |
1.93 |
1.67 |
0.64 |
1.48 |
0.91 |
|||
|
H |
X |
12.65 |
46.1 |
71.6 |
40.7 |
47.9 |
15.2 |
24.8 |
35.3 |
||
|
se |
0.84 |
3.73 |
21.09 |
4.21 |
8.73 |
1.07 |
2.7 |
7.62 |
|||
|
F |
X |
15.25 |
102.6 |
95.5 |
102.8 |
75.4 |
19.7 |
22.8 |
75.8 |
||
|
se |
1.03 |
12.88 |
25.35 |
22.87 |
9.47 |
2.15 |
1.93 |
14.62 |
|||
|
sem 9.5*** |
|||||||||||
Table 20. For details of the trial, see Ionox Irish controlled trial (Nov 95-Aug 96), above. Treatment means for blood PII (ug/L) and GPx (iu/g Hb) for steers on 0, 1 and 2 Ionox boluses. Means with differing suffixes in the same column are significantly different.
|
Gp |
Pre |
d26 |
d61 |
d93 |
d119 |
d159 |
d181 |
d208 |
d236 |
| PII | |||||||||
|
0 |
15a |
14a |
23a |
26a |
15a |
19a |
21 |
20 |
10 |
|
1 |
16a |
162b |
124b |
94b |
63b |
70b |
40 |
32 |
9 |
|
2 |
16a |
383c |
280c |
218c |
160c |
104c |
25 |
25 |
9 |
|
Sig. |
ns |
*** |
*** |
*** |
*** |
*** |
ns |
ns |
ns |
| GPx | |||||||||
|
0 |
48a |
42a |
41a |
52a |
42a |
50a |
49a |
54a |
45a |
|
1 |
57a |
59b |
69b |
75b |
68b |
72b |
65a |
66a |
63b |
|
2 |
57a |
56b |
78b |
87c |
84b |
89b |
89b |
89b |
69b |
|
Sig. |
ns |
* |
*** |
*** |
** |
** |
*** |
*** |
** |
Table 21. For details of the trial, see Ionox UK field trial 1997, above. Means and se pretrial (S0) and after 1 month (S1), mean change from pretrial value and se of change for blood PII, and net effect of treatment (ug/L) in control (untreated) and experimental (one bolus) cows in the UK field trial. (*** = significant at p<.001).
|
Control cows |
Treated cows |
Net Effect |
|||||
|
S0 |
S1 |
Change |
S0 |
S1 |
Change |
||
|
X |
80.7 |
109.1 |
28.4 |
80.1 |
225.8 |
145.7 |
117.3 |
|
se |
5.7 |
9.4 |
6.9 |
5.9 |
12.1 |
10.9 |
10.7 |
|
Sig. |
*** |
*** |
*** |
Table 22. For details of the trial, see PII response in steers to oral and skin applied I, above. Mean PII levels (ug/L) for samples taken between d1 and d57 from steers that had received 0 (C), 7 consecutive daily oral doses of 10 mg I/100 kg LW (D), or 70 mg I/100 kg LW applied to the skin of the flank fold on d1 (F).
|
Tr |
Pre |
d1 |
3 |
5 |
7 |
8 |
9 |
12 |
15 |
19 |
22 |
29 |
43 |
57 |
|
C |
19 |
41 |
34 |
38 |
45 |
32 |
65 |
59 |
57 |
33 |
38 |
37 |
13 |
20 |
|
D |
20 |
128 |
166 |
187 |
204 |
126 |
144 |
56 |
55 |
31 |
41 |
38 |
13 |
24 |
|
F |
22 |
458 |
279 |
96 |
84 |
57 |
118 |
75 |
52 |
36 |
39 |
40 |
17 |
21 |
|
Sig |
ns |
*** |
*** |
*** |
*** |
*** |
** |
ns |
ns |
ns |
ns |
ns |
ns |
ns |
Underlined values are in the normal range, except 1615h sample (at 7 h after treatment on D1 (Gp F), which was very high.
Table 23. For details of the trial, see Lipiodol Trial 1, above. Mean PII (ug/L) in control (C) and Lipiodol-injected (L) steers pretrial (Pre) and for 57d after the start of trial.
|
Tr |
Pre |
d1 |
3 |
5 |
7 |
8 |
9 |
12 |
15 |
19 |
22 |
29 |
43 |
57 |
|
C |
19 |
41 |
34 |
38 |
45 |
32 |
65 |
59 |
57 |
33 |
38 |
37 |
13 |
20 |
|
L |
18 |
40 |
63 |
87 |
125 |
105 |
140 |
144 |
166 |
162 |
128 |
166 |
60 |
17 |
|
Sig |
ns |
ns |
* |
*** |
*** |
*** |
** |
*** |
*** |
*** |
*** |
*** |
*** |
ns |
Underlined values are in the normal range.
Table 24. For details of the trial, see Lipiodol Trial 2, above. Mean PII (ug/L) in control (Gp 1) and Lipiodol-injected steers (Gp 8) pretrial (Pre) and for 126d after the start of trial.
|
Gp |
Pre |
8 |
15 |
22 |
29 |
36 |
43 |
50 |
57 |
64 |
67 |
70 |
73 |
76 |
80 |
86 |
95 |
105 |
115 |
126 |
|
1 |
20 |
19 |
20 |
13 |
10 |
10 |
7 |
5 |
8 |
16 |
11 |
12 |
12 |
12 |
9 |
13 |
15 |
17 |
24 |
44 |
|
8 |
23 |
115 |
121 |
102 |
84 |
88 |
79 |
76 |
84 |
100 |
122 |
135 |
117 |
109 |
90 |
74 |
66 |
72 |
63 |
57 |
|
sem |
4.6 |
11 |
13 |
12 |
12 |
7 |
4 |
5 |
6 |
6 |
12 |
18 |
16 |
19 |
14 |
13 |
5 |
12 |
9 |
21 |
|
Pr<F |
ns |
*** |
*** |
*** |
*** |
*** |
*** |
*** |
*** |
*** |
*** |
*** |
*** |
*** |
*** |
*** |
*** |
*** |
*** |
ns |
Underlined values are in the normal range.
Table 25. For details of the trial, see PII response in donkeys after drenches of 0.05-0.20 mg I/kg LW, above. Mean PII (ug/L) in donkeys (Tr 1 to 5) dosed orally with 0, 0.05, 0.10, 0.15 or 0.20 mg I/kg LW/d, respectively.
| ------------------------ |
Days of dosing (1, 2, 7) |
Days of no dosing (8, 10, 13) |
|
Gp |
0 (Pre) |
1 |
2 |
7 |
8 |
10 |
13 |
|
1 |
6.8 |
7.4 |
4.4 |
5.3 |
8.2 |
12.8 |
4.3 |
|
2 |
4.5 |
41.2 |
33.9 |
33.0 |
31.1 |
14.2 |
7.5 |
|
3 |
7.0 |
70.3 |
49.4 |
60.0 |
60.8 |
15.5 |
4.2 |
|
4 |
5.0 |
102.1 |
68.4 |
83.6 |
73.8 |
15.8 |
4.0 |
|
5 |
5.8 |
108.0 |
91.6 |
89.8 |
94.4 |
11.3 |
5.7 |
|
Sig. |
ns |
*** |
*** |
*** |
*** |
ns |
ns |
Table 26. For details of the trial, see PII in steers after an I drench or I by continuous infusion, above. Mean PII ((ug/L) in steers (Gp 1 to 4) dosed orally with 0, or 0.10 (once, twice in two equal parts, or continuously infused into the rumen) mg I/kg LW/d, respectively. -- -----_ __
| ------------------------ |
Days of dosing (1, 2, 7) |
Days of no dosing (8, 10, 13) |
|
Gp |
0 (Pre) |
1 |
2 |
7 |
8 |
10 |
13 |
|
1 |
9.5 |
12.3 |
11.3 |
9.4 |
10.8 |
13.0 |
10.8 |
|
2 |
9.0 |
206.2 |
203.4 |
349.8 |
365.5 |
195.5 |
42.0 |
|
3 |
8.5 |
183.8 |
196.1 |
353.4 |
461.3 |
238.3 |
102.7 |
|
4 |
12.5 |
175.1 |
198.1 |
339.2 |
509.8 |
279.5 |
109.2 |
|
Sig. |
ns |
*** |
*** |
*** |
*** |
*** |
*** |
Table 27. For details of the trial, see PII response in sheep after an I drench, above. Mean PII (ug/L), sem, value of Pr >F and the significance of the treatment mean differences in lambs drenched once with 0, 1.02 and 2.04 mg I/kg LW.
|
Tr |
d0 |
d1 |
d2 |
d3 |
d4 |
d7 |
d14 |
|
0 |
8.0 |
13.6 |
12.6 |
13.6 |
13.4 |
6.2 |
6.2 |
|
1 |
12.2 |
698.8 |
299.4 |
129.4 |
55.6 |
10.0 |
8.0 |
|
2 |
8.4 |
1299.8 |
545.6 |
225.6 |
99.4 |
13.4 |
8.0 |
|
sem |
1.75 |
59.77 |
44.79 |
24.36 |
10.72 |
0.75 |
1.16 |
|
Pr>F |
0.215 |
0.0001 |
0.0001 |
0.0002 |
0.0004 |
0.0001 |
0.471 |
|
Sig |
ns |
*** |
*** |
*** |
*** |
*** |
ns |
Table 28. Summary of mean PII increases (ug/L) above control changes in response to known oral supplements of I.
|
Animal type |
Trial |
Oral I dose (mg/100 kg LW/d), assuming cows at 600 kg |
PII increase (ug/L) above control changes |
| Cows, dairy |
5.000 |
35 |
|
| Cows, dairy |
7.167 |
57 |
|
| Cows, dairy |
7.500 |
42 |
|
| Cows, dairy |
8.333 |
113 |
|
| Cows, dairy |
10.000 |
75 |
|
| Cows, dairy |
10.000 |
82 |
|
| Calves 4 mo suckling |
5.000 |
41 |
|
| Heifers, beef |
1.667 |
60 |
|
| Heifers, beef |
3.333 |
117 |
|
| Heifers, beef |
6.667 |
212 |
|
| Heifers, beef |
10.000 |
304 |
|
| Cows, beef, dry |
3.000 |
43 |
|
| Cows, beef, dry |
6.000 |
94 |
|
| Cows, beef, dry |
12.000 |
159 |
|
| Cows, beef, dry & suckling |
2.667 |
63 |
|
| Cows, beef, dry & suckling |
5.333 |
136 |
|
| Cows, beef, dry & suckling |
10.833 |
260 |
|
| Cows, beef, suckling |
5.000 |
43 |
|
| Steers |
3.333 |
94 |
|
| Steers CoX |
5.000 |
67 |
|
| Steers Fr |
5.000 |
60 |
|
| Steers Fr |
5.167 |
48 |
|
| Steers |
6.667 |
166 |
|
| Steers |
10.000 |
273 |
|
| Steers |
10.000 |
272 |
|
| Steers Fr |
10.333 |
115 |
|
| Steers |
11.000 |
116 |
|
| Steers Fr |
15.500 |
149 |