|
|
|
|
|
|
|
|
|
 .
. 
|
|
|
|
|
|
|
|
|
Land Classification
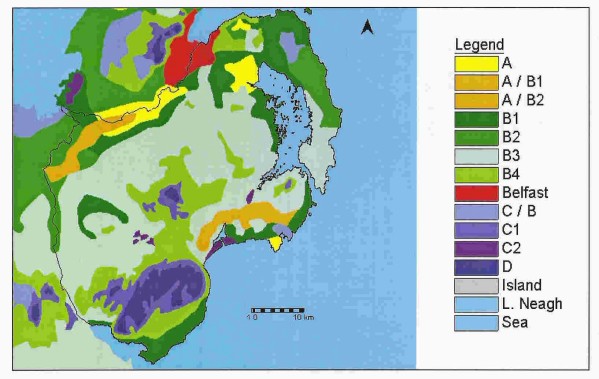
The Land Classification Map of Northern Ireland (1963) grades land from A, to D. The characteristics of each grade are listed in Table 3 and their distribution in County Down can be seen in Figure 5.
Figure 5
Land Classification in County Down
(After the Land Classification Map of Northern Ireland, 1963)
Land classification characteristics
|
Land classification |
Characteristics |
Area in Co. Down |
|
A |
High quality land. |
81.4 km2 |
|
A / B1 |
Mixed high / medium quality land. |
68.8 km2 |
|
A / B2 |
Mixed high / medium quality land. |
60.2 km2 |
|
B1 |
Medium quality, light or sandy texture. |
389.9 km2 |
|
B2 |
Medium quality but heavy clay texture or high water table. |
145.8 km2 |
|
B3 |
Medium quality, but with adverse factors of slope or shallow soil and unevenness of quality. Individual fields may vary from Class A to C2. |
1038.5 km2 |
|
B4 |
Medium quality, with adverse factors, more adverse than B3 and unevenness of quality more marked. |
341.4 km2 |
|
C1 |
Poor or marginal quality hill land and rocky or steep lowlands. |
125.1 km2 |
|
C2 |
Poor quality, peaty and ill-drained lowlands. |
17.2 km2 |
|
C / B |
Mixed medium / poor quality. |
27.9 km2 |
|
D |
Very poor quality, mountainous or lowland bog, marsh and sand dunes. |
106.8 km2 |
CORINE Land Cover maps
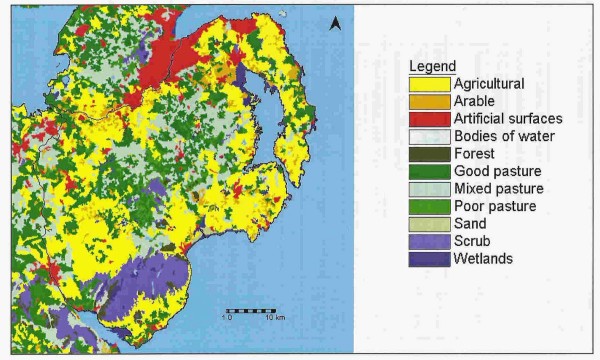
The CORINE map grades the land according to its current uses. These categories are listed in Table 4 and their distribution in County Down can be seen in Figure 6.
CORINE Land Cover for County Down (After the European Environment Agency, 1990)
CORINE characteristics
|
CORINE classification |
Characteristics |
Area in Co. Down |
|
Artificial surfaces |
Urban fabric, industrial or commercial areas mineral extraction and dump sites |
101.7 km2 |
|
Arable land |
Non-irrigated arable. |
131.5 km2 |
|
Heterogeneous agricultural areas |
Annual crops and complex cultivation, i.e. mixed arable, vegetables and good pasture |
. 882.8 km2 |
|
.Forest. |
Broad leafed, coniferous and mixed forest |
46.5 km2 |
|
Scrub and grassland |
Natural grassland, moors, heathland and transition woodland/ scrub |
189.4 km2 |
|
Wetlands |
Inland marshes, peat bogs, inter-tidal flats. |
83.2 km2 |
|
Bodies of water |
Streams, inland bodies of water, estuaries, sea. |
120.9 km2 |
|
Good pasture |
Good pasture land |
503.7 km2 |
|
Poor pasture |
Poor pasture land |
108.9 km2 |
|
Mixed pasture |
Mixed pasture land. |
351.5 km2 |
Overall these three maps combine to provide detailed information on the physical environment of County Down.
Climate
Ireland has cool summers and mild but damp winters. Fifteen hundred years ago it is likely that the climate in County Down was something similar to today, although Lamb (1981, 57 - 60) has noted that in Europe at around AD 400, and for a century and a half before that, a warm dry climate seems to have prevailed. In the late AD 500s however, there is a turn towards colder summers and wetter conditions which probably lasted until almost AD 700, when there was a return to the 'more continental' drier and warmer summers and colder winters.
Environmental evidence
Environmental evidence has suggested that much of Ireland in the Early Christian period would have been heavily forested, but with frequent clearings for agriculture, as well as the more open expanses of pasture on the mountains, used for transhumance during the summer months. Pollen samples indicate that at about AD 400 the predominance of tree pollen in samples begins to decrease and the quantity of grass and cereal pollen begins to rise, indicating clearance and increased agriculture.
Agriculture in Early Christian Ireland
It is obvious from both the Early Christian law tracts and the excavation evidence the important role which cattle played throughout this period. The Críth Gablach indicates that cattle made up 70% of the stock of the typical independent farmer although McCormick (1983, 264) also points out that '...the minimum number of individuals percentages vary considerably between sites… probably due to differing economic and /or environmental circumstances'. It is, however, easy to overemphasise the role which cattle played in food production and Ó Croinin (1995, 90) has pointed out that agricultural practices as depicted in the documentary sources show a heavy emphasis on crop cultivation, a view which has been supported by both the archaeological and pollen evidence. McCormick's study of a number of sites in the Lecale region of County Down has indicated to him that in this area cereal production, as opposed to livestock, dominated the local economy, at least during the medieval period. There would have been quite a wide range of cereals grown in Early Christian Ireland, of which the law tracts mention nine types including oats, wheat, barley and rye.
Land
There has been much debate on the issue of land ownership and the size of area farmed by the various grades of Early Christian society. Attempts have been made to calculate the size of a tír cumal, the basic land holding unit in Early Christian Ireland. Estimates have varied widely and no firm conclusions have been reached, although Mac Néill (1923, 286-7) has tentatively suggested that one tír cumal equals 34.23 acres. Based on these figures Stout (1997, 111) has calculated the amount of land various grades in early Irish society may have possessed and the results can be seen in Table 5 below.
Summary of free status, land holding and clientship from the law tracts
(after Stout 1997, 111)
|
Grade |
Honour price (in cumal) |
Tír cumaile |
|
Number of bóaire clients |
Number of ócaire clients |
|
Rí túaithe |
|
|
|
|
|
|
Aire forgill |
|
|
|
|
|
|
Aire ard |
|
|
|
|
|
|
Aire túise |
|
|
|
|
|
|
Aire déso |
|
|
|
|
|
|
Bóaire |
|
|
|
|
|
|
Ócaire |
|
|
|
|
|
Proudfoot (1961, 119) used an area of sixty acres surrounding each rath when he was analysing Early Christian settlement patterns in County Down. Charles-Edwards (1972) argues for the similarities between the land held by the freeman, or bóaire, in Ireland and the hide, or land held by a freeman in England, which has been calculated at one hundred and twenty acres. Because of the uncertain nature of any of these suggestions these figures are not used in the later analyses, but were taken into consideration when deciding on the size of catchment zones .
Stocking rates
In his statistical survey of County Londonderry in 1802 Sampson (1802, 182) estimates the stocking rate for the land at:
Horse 1.5 acres;
Cow 1 acre;
Sheep 0.25 acres.
Mallory and Woodman (1984, 55) have suggested that 'Given the smaller size of the livestock of the Early Christian period, the fodder requirements of each species is likely to have been somewhat lower', but this is probably as close an estimate for the amount of land each Early Christian farmer would have required for his livestock as it is possible to achieve.
There is very little information about the foddering of livestock in ancient Ireland, however 'the consensus … is that the Irish made little or no hay for their cattle and relied instead on grass which had been fenced off or otherwise preserved from grazing during the summer, so that it was available in winter as hay-on-the-root, so to speak' (Lucas 1989, 35). Lucas also cites evidence from the early literature for the use of woodland for foddering livestock over the winter period.
The literature also suggests that a bóaire would have sown sixteen sacks of grain each year, and Mitchell (1986, 167) points out that if this was at a rate of two sacks per acre this would have given only eight acres under crop, which seems very little. This, however may be a minimum figure to qualify for the social grade of bóaire, and we should remember that on top of this he may have sown grain to provide tribute for his lord, and possibly also a surplus to sell.
Having looked at all these factors which would have influenced the patterns of settlement in Early Christian County Down a series of analyses were carried out and the details of these can be seen below.
Settlement distribution patterns
The following analyses use the four digitised basemaps, Contour, Land Classification, Soil and CORINE to provide the environmental data and was overlaid with a point layer, representing each Early Christian site. This section looks at the general distribution patterns and a chi-squared test was applied to determine the statistical significance of this analysis. The 5% probability level was selected for use in this study and in the following tables significant results have been highlighted using red to indicate those which are higher than expected and blue for those which are lower. The results produced by this chi-squared test allow us to determine which factors influenced Early Christian settlement, and whether they encouraged or discouraged settlements in a certain areas.
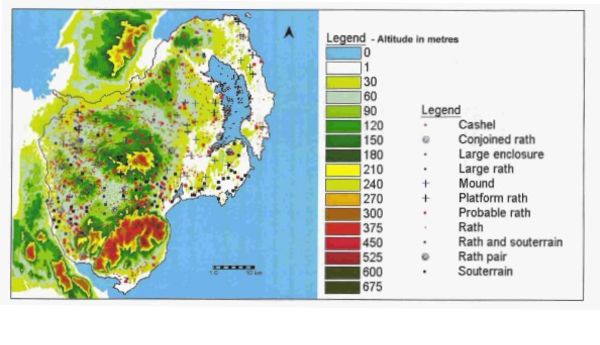
We can immediately see from Figures 7 and 8 below that there are patterns in the distribution of the various site types in County Down. There are very few raths on the Ards Peninsula and in the Lecale area, areas which appear to be dominated by ecclesiastical sites. In his study of the Lecale area, McCormick (1997, 37) suggested that 'It could be the case that in areas where the Church was an extensive land owner, secular ownership was more limited, a situation reflected by a low ringfort density'. As we move further west across the county the rath distribution becomes much more dense, a pattern which is repeated by the majority of the site types, including both bivallate and multivallate raths.
In contrast to this pattern, there is a cluster of raised raths within the Lecale area, with none to the west of the county: a pattern very different from that of the 'ordinary' raths. Mytum (1992, 126) has suggested that the high mounds of these raised raths may indicate high social status and perhaps this explains why raised raths were able to settle on land close to ecclesiastical sites, where the lower status sites were not. Raised raths again avoid the Ards Peninsula, although a number of platform raths can be found within this area. Cashels and souterrains also have an unusual distribution pattern when compared to that of the majority of the Early Christian settlements in the county. The cashels cluster in the small areas between the Mournes and Slieve Croob and just to the west of the Mournes, in the uplands, as we may have expected. The souterrains can also be found in this area between the Mournes and Slieve Croob, and in fact seem to run in a band east - west from here across the county. Surprisingly there are quite a number of souterrains in the Lecale area, which may help to explain the apparent lack of raths in this area:
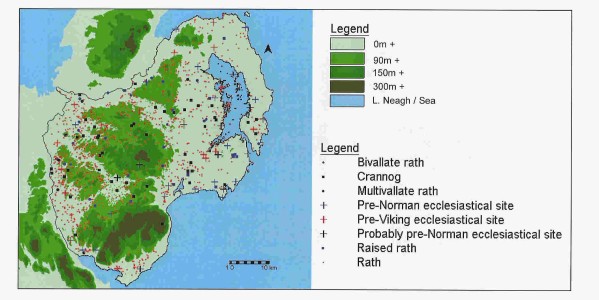
Figure 8 General distribution of Early Christian sites
perhaps there was another form of settlement or the raths were there but have been completely removed because of the very good quality of the soil in the Lecale area. Both the pre-Viking and pre-Norman ecclesiastical sites have a predominately lowland, coastal distribution although there are a number of ecclesiastical sites established in the inland areas. The probably pre-Norman sites share a similar distribution pattern. Already we can see the distinction between these ecclesiastical sites and the secular settlements of the Early Christian period. Mytum (1982, 353), in his study of early churches in County Clare also found that 'the early churches cannot be directly related to the distribution of the secular population as indicated by ring-forts'. This, and other relationships between site types, are examined in much more detail below.
Altitude analysis
It is reasonable to expect that the Early Christian people would have settled at a middling altitude, suitable for farming, and this expectation is borne out by the results in Table 6 below.
Summary of totals for each altitude zone
Altitude zone (metres) Area of altitude zone (km2) % of total area of Co. Down % of sites within altitude zone Settlement density per km2 Chi-squared value 0 - 30 30 - 60 60 - 90 90 - 150 150 - 210 210 -300 300 + -
(Chi-squared values become significant at 3.8)
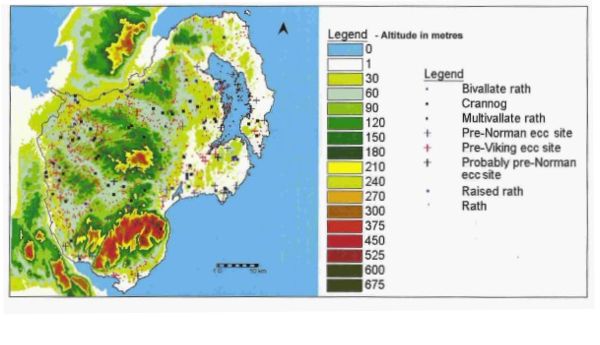
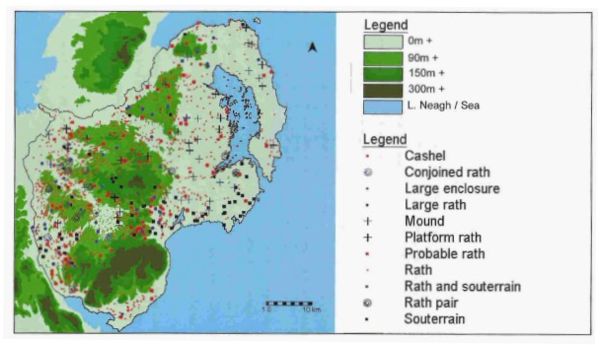
Fig 10 Distribution of Early Christian sites on the detailed contour map
From this summary we can see that 40% of all Early Christian sites are located within the 90m - 150m band, which makes up only 24% of the landmass of County Down. The 60m - 90m zone also produces a statistically significant result again indicating that this was a preferred altitude for settlement while both the highest and lowest altitude areas were clearly deliberately avoided.
Table 7 shows the distribution of each site type across each of the altitude zones and Table 8 the results of applying the chi-squared test to this distribution.
Raised raths are the only site type with a strong preference for the 30m - 60m altitude zone, contrasting with raths which are shown to avoid these lowland areas. Perhaps the fact that they are located in lower-lying areas may suggest that these sites were deliberately raised both to see and be seen, or simply to avoid flooding, rather than as a status symbol? At the opposite end of the scale, a significant proportion of cashels are located in the uplands, above 150m.
Table 7
The number of sites in each altitude zone
|
Altitude zone (m) |
0 - 30 |
30 - 60 |
60 - 90 |
90 - 150 |
150 - 210 |
210 + |
|
Rath |
121 |
191 |
264 |
479 |
63 |
3 |
|
Probable rath |
9 |
10 |
12 |
19 |
3 |
0 |
|
Platform rath |
7 |
11 |
7 |
8 |
4 |
0 |
|
Raised rath |
4 |
7 |
0 |
4 |
0 |
0 |
|
Rath and souterrain |
2 |
3 |
1 |
6 |
1 |
0 |
|
Large rath |
0 |
0 |
2 |
3 |
1 |
0 |
|
Conjoined rath |
0 |
0 |
1 |
1 |
0 |
0 |
|
Rath pair |
0 |
2 |
2 |
6 |
0 |
0 |
|
Bivallate rath |
0 |
4 |
5 |
10 |
0 |
0 |
|
Multivallate rath |
1 |
2 |
1 |
2 |
0 |
0 |
|
Large enclosure |
2 |
4 |
8 |
16 |
3 |
0 |
|
Cashel |
2 |
6 |
10 |
28 |
14 |
2 |
|
Crannog |
11 |
6 |
16 |
11 |
1 |
1 |
|
Mound |
2 |
5 |
4 |
0 |
0 |
0 |
|
Souterrain |
19 |
14 |
9 |
9 |
6 |
0 |
|
Ecclesiastical sites |
. |
. |
. |
. |
. |
. |
|
Pre-Viking |
7 |
6 |
2 |
1 |
0 |
0 |
|
Pre-Norman |
9 |
5 |
1 |
2 |
0 |
0 |
|
Probably pre-Norman |
7 |
2 |
2 |
1 |
0 |
0 |
|
Total no. of sites |
203 |
278 |
347 |
606 |
96 |
6 |
![]()