WEB VERSION
ONLY
Contact Teagasc HQ, Sandymount Avenue, Dublin 4,
Ireland
for a copy of the printed
report
Copper, Iodine and Selenium Status in Irish
Cattle
Philip A.M. Rogers MVB,
MRCVS
Teagasc, Grange Research Centre,
Dunsany, Co. Meath
End of Project
Report
July 2001
Project No. 4382
Teagasc acknowledges with gratitude the
support of the European
Union Structural Funds (EAGGF) in financing this
research project
CONTENTS
1 SUMMARY AND CONCLUSIONS
2 INTRODUCTION
3
MATERIALS & METHODS
4
RESULTS
4a
Overall copper (Cu), iodine (I), selenium (Se) and haemoglobin (Hb) status in
Irish cattle at slaughter
4b
Liver Cu status
4c
Blood Cu status
4c.1
Cu levels in liver versus whole blood in the assessment of bovine Cu
status
4d
Blood PII status
4e
Blood GPx status
4f
Blood Hb status
4g
Relationships between glutathione peroxidase (GPx) levels in blood and Se levels
in liver and kidney
4h
Risk of trace element toxicity to cattle or humans
5
OVERALL CONCLUSIONS
6 ACKNOWLEDGEMENTS
7 REFERENCES &
PUBLICATIONS
8
TABLES & FIGURES
1. SUMMARY
At 9 abattoirs throughout the state, samples of blood, liver and
kidney were collected from the three cattle categories (cull dairy cows, cull
beef cows and finished steers) at slaughter. In all, 2612 cattle were sampled
for the following assays: copper (Cu), haemoglobin (Hb) and glutathione
peroxidase (GPx, a selenoenzyme) on whole blood, inorganic iodine (I) in plasma,
and Cu in liver and selenium (Se) in a subset of liver and kidneys.
The survey documented the overall status of Cu, I and Se in
Irish cattle at slaughter and compared the trace element status of three
categories of cattle. It also examined the effects of housing / season (late
spring versus late autumn).
- I deficiency was the most prevalent mineral deficiency in all
three bovine categories. Overall, in spite of whatever supplementation was
being used preslaughter, 69% of samples had low (<50 ug/L) plasma inorganic
I status (51% at the end of spring, 84% at the end of autumn).
- Overall, in spite of whatever supplementation was being used
preslaughter, liver Cu status was low (<20 mg/kg DM) in 19% of samples (11%
at the end of spring, 26% at the end of autumn). Liver Cu reflects Cu status
more accurately than blood Cu. However, the relationships between Cu levels in
liver and blood were poor in these data; it was not possible to predict a
blood Cu level accurately from a given liver Cu level. Also, relative to liver
levels, blood levels underestimated the extent of low Cu status by a factor of
>2, with a wide range of error (0.9-2.6 times). However, as liver biopsy
seldom is a practical option in commercial herds, blood tests usually are used
for routine assessment of mineral status in live cattle.
- GPx levels in whole blood closely reflect blood Se status. In
spite of whatever supplementation was being used preslaughter, blood GPx
status was low (<40 iu/g Hb) in 11% of samples (4% at the end of spring,
16% at the end of autumn). In a subset of the data, blood GPx and Se levels in
bovine kidney and liver had positive linear relationships but predictability
was poor. A similar conclusion applies to levels of Se in liver and kidney.
Also, liver Se correlated better with blood GPx (R2 = 0.443) than
with kidney Se (R2 = 0.264).
- Cattle slaughtered off grass in late autumn had lower Cu, I
and Se status than those slaughtered out of sheds in late spring.
- Finished beef steers and cull suckler cows had lower Cu and
Se status than cull dairy cows.
- Liver and kidney had few high Cu or Se levels, indicating
that current inputs of minerals do not pose a threat of toxicity to cattle, or
to the human food chain. Mean PII levels in dairy cows were too low to pose a
threat of excessive milk I levels for human consumption.
- Other research at Grange shows that trace element
supplementation and trace element status in bovine blood, especially from
dairy cows, improved nationally in recent years. However, this survey shows
clearly that current national inputs of Cu, I and Se are inadequate to
maintain normal trace element status in finished steers and cull (especially
beef) cows at slaughter.
This report concludes that
- current national inputs of Cu, I and Se are inadequate to
maintain normal trace element status in finished steers and cull (especially
beef) cows at slaughter, and
- from current inputs, the risk of Cu or Se toxicity to
cattle, or to the human food chain, is minimal
.
2. INTRODUCTION
In the winter of 1989-90, 27 Irish compounders
provided details of the cost and mineral-vitamin inputs in their mineral
supplements for cattle and sheep (1). Table 1
shows the mean daily mineral supplement recommended for cows and finishers by
the compounders. The daily supply of minerals varied widely between
formulations.
Table
2 and Table
3 shows data from Johnstown Castle on mineral composition of
Irish forage samples analysed in 1990-1993 and the breakpoints used to assess
the adequacy or otherwise of the mineral composition of forage for cows (2). Irish
herbage and silage had an alarmingly high prevalence of mineral imbalance. These
data confirmed data from the 1970s and 80s, in which analysis of blood and
forage samples had indicated widespread mineral imbalances in unsupplemented
cattle (3).
It was decided to adopt a proactive national campaign to stress the need for
routine supplementation of cattle with magnesium (Mg), copper (Cu), iodine (I),
selenium (Se) and other minerals important for bovine productivity (4).
Thus, from the early 1990s, Teagasc
advised Irish companies that formulated cattle feeds and supplements to provide
mean Cu, I and Se supplementation rates (mg/cow/d) of 450, 60 and 7 (reduced to
5 in 1996), respectively, and pro rata for lighter stock (4, 5). These
are high supplementation targets relative to those used in most European States.
They were set high deliberately, as earlier work had shown these inputs to be
necessary to maintain normal blood status in Irish cattle.
The selenoenzyme glutathione peroxidase
(GPx) is used to assess blood Se status. In 1970 and 1979, respectively, at the
start of a national monitoring of bovine blood mineral levels, circa 63 and 64%
of herds tested had low Cu and Se status, respectively. Until 1991 we had no
reliable test for routine use in national monitoring programmes of bovine I
status. Before that we had tried and abandoned many tests (thyroid hormones (T3
and T4), plasma protein-bound I (PBI) and milk I) because they had proved to be
unreliable in the diagnosis of I deficiency. By 1991 we had developed the
capacity to use plasma inorganic I (PII) for mass screening of I status in
animals. In 1991 and 1992, 58-62% of all herds tested had low PII status.
Subsequently, we confirmed that PII is a very sensitive test of current I inputs
(6).
The percentage of commercial Irish
herds in the lowest categories (very low + low) for Cu, GPx and PII status in
the period 1970-87(3),
1991-97 (7)
and 1998-2000 (8)
was:
|
Year |
1970 |
79-84 |
85-87 |
91 |
92 |
93 |
94 |
95 |
96 |
97 |
98 |
99 |
2000 |
|
Cu |
63.0 |
50.0 |
25.0 |
4.1 |
3.9 |
3.6 |
1.6 |
2.5 |
1.7 |
0.9 |
2.1 |
1.7 |
1.6 |
|
GPx |
* |
64.0 |
30.0 |
8.8 |
11.5 |
16.5 |
7.8 |
2.4 |
1.3 |
0.9 |
2.8 |
1.0 |
2.3 |
|
PII |
* |
* |
* |
57.6 |
62.4 |
57.4 |
38.1 |
32.1 |
36.4 |
43.3 |
45.9 |
43.4 |
39.4 |
* No test available at the time
There was a marked improvement in Cu and Se status in bovine
blood samples tested from 1970s-80s through the 1990s. This improvement was due
to increasing awareness amongst the trade, the agricultural and veterinary
professionals, and the farming community of the need to supplement cattle with
trace elements. Though I status improved in the mid 90s, it deteriorated again
in the late 90s. PII rises and falls very rapidly, depending on current I supply
from all sources. Forage-fed cattle are likely to have very low I status unless
they are currently being fed a generous I supplement.
However, the blood data referred to above were mainly from
larger dairy herds and reflected higher rates of mineral
supplementation in dairy herds than in suckler and drystock herds.
Irish beef herds usually are smaller than dairy herds; beef herds usually
receive less mineral supplements, or less reliable supplements, than dairy
herds. Profit margins in beef farming are less than in dairying, and relatively
few beef farmers had their herds tested for mineral status in the Grange Lab.
Therefore, we had relatively few data to assess the mineral status of beef
herds; from those limited data, we suspected that trace element deficiencies
were more prevalent in beef herds.
In the late 1990s, there was concern that continuous or
long-term use of high-specification mineral supplements could have possible
adverse effects. Because the extent of national uptake of our recommendations
was unknown, a survey was designed with two main aims:
- to document the status of Cu, I and Se in Irish cattle at
slaughter and
- to monitor the possible risk of bovine trace element
poisoning by documenting the highest levels of Cu and Se detected in animal
tissue.
Therefore, this survey was designed (a) to document the
overall status of Cu, I and Se in Irish cattle at slaughter, (b) to compare the
trace element status of three categories of cattle (cull dairy cows, cull beef
cows and finished steers), (c) to examine the effects of housing / season (late
spring versus late autumn), and (d) to monitor the possible risk of bovine trace
element poisoning by documenting the highest levels of Cu and Se detected in
animal tissue.
At 9 abattoirs throughout the state, samples of blood, liver and
kidney were collected from the three cattle categories. In all, 2612 cattle were
sampled, c. 46% at the end of the winter period and c. 54% off grass in late
autumn. The following assays were done: Cu, Hb and GPx on whole blood, plasma
inorganic iodine (PII), Cu in liver and Se in a subset of livers and kidneys.
The data were examined under headings (a) to (c), above. Relationships between
levels of Cu in liver and blood, and between Se in liver and kidney and GPx in
blood were examined also.
The most important finding was that I deficiency was the most
prevalent mineral deficiency in all three bovine categories. Overall, in spite
of whatever supplementation was being used preslaughter, 69% of samples had low
(<50 ug/L) plasma inorganic I status (51% at the end of spring, 84% at the
end of autumn).
3. MATERIALS AND METHODS
The two main aims were (1) to document the status of Cu, I and
Se in Irish cattle at slaughter and (2) to monitor the possible risk of bovine
trace element poisoning by documenting the highest levels of Cu and Se detected
in animal tissue.
Those aims were to address three hypotheses as regards bovine
trace mineral status, i.e. that:
- it would be better at the end of winter feeding than at the
end of the grazing season;
- it would be higher in cull dairy cows than in finished
steers or cull beef cows;
- it would pose no significant toxic risk to cattle or
humans.
To test these hypotheses, we sampled approximately 400 cattle
in each of three categories (cull dairy cows, cull suckler cows and finished
steers) at each of two slaughter times (in late autumn and in late
spring).
To get samples representative of the national status, two
technical teams visited 9 abattoirs to collect samples of heparinised whole
blood, liver and kidney from 2612 slaughtered cattle at the times described
above. The abattoirs were in Ballyhaunis, Ballyjamesduff, Bandon, Charleville,
Clonmel, Freshford, Longford, Rathkeale and Watergrasshill.
Samples were assayed for copper (Cu), haemoglobin
(Hb) and glutathione peroxidase (GPx) on whole blood and Cu in liver. Because
the activity of the selenoenzyme GPx is expressed as iu/g Hb, it was necessary
to assay all samples for Hb as part of the GPx assay. Although Hb is not related
directly to trace element status, its data are included in the report. Table 4
shows the breakdown of the numbers of test results used for statistical
analysis.
Dr. James McLaughlin, Biochemistry Department, Veterinary
Research Laboratory, Abbotstown, Castleknock, Dublin, arranged for 46 paired
liver and kidney samples to be analysed for Se levels. These samples were
selected to represent the maximum spread of blood GPx values in the
survey.
The data for analysis were formatted on one Excel
sheet, as shown in Table 5.
Mr. Tony Hegarty, Teagasc HQ, used the SAS Package for statistical analysis of
the raw data. Statistics were calculated for the overall Cu, GPx (Se), Hb and I
status, and for the effects on those variables of:
- Animal type
(cull dairy cows versus
cull suckler cows versus finished steers), and
- Slaughter season
(late spring versus
late autumn).
Relationships between levels of Cu in liver and blood, and
between Se in liver and kidney and GPx in blood were examined in separate
analyses using the Statistics Package and Chart Wizard on Microsoft
Excel.
- RESULTS
Preliminary examination of the data showed that there were
complex 3-way interactions in the data between location (abattoir), animal type
and slaughter season. Because the survey was not designed to study the effect of
location, data from all abattoirs were pooled as "national data". Study of the
specific effects of location would require much more detailed sampling protocol,
and would require retrospective confirmation of all samples to specific
locations. That was not possible in this survey and should be considered in a
future work.
Preliminary examination also showed that liver Cu and PII had
skewed distributions; their values concentrated heavily in the left three
columns of 23- and 21- column distribution curves, respectively. Skewed data
usually need non-parametric analysis, or log-transformation. However, for
simplicity and to keep the tabulation in a standard form, it was decided to run
all the data in the standard SAS-Anova programme.
The following sections and tables show SAS-adjusted
means. Least significant differences (LSDs) were calculated conservatively by
the formula (LSD = 2 * se * Y ), where
se = the largest standard error in the comparison, and
Y = the square root of 2.
4a. Overall Cu, I, Se and Hb status in Irish
cattle at slaughter
Table 6
shows the breakpoints used to classify individual animal mineral status into one
of five groups: 1=very low, 2=low, 3=marginal, 4=normal and 5=high. Table 7
shows the overall mean values (x) and standard errors (se) for liver Cu and
blood Cu, PII, GPx and Hb.
Overall means were normal, except for PII, which was
classed as marginal to low. However the coefficients of variation (CV) for liver
Cu and blood Cu, PII, GPx and Hb were 83, 21, 124, 45 and 16%, respectively.
This indicates that the mean values for liver Cu, PII and GPx masked huge
variation for all test parameters.
Table 7
also shows the percentage of samples classed as "low + very low" (%LO) and
"High" (%HI) for each test. Overall, 19.3, 9.0, 68.5, 10.8 and 7.4% of liver Cu,
blood Cu, blood PII, GPx and Hb values, respectively, were in the LO
class.
Few values were in the HI class. Hb was an exception; it had
18.6% of samples classed as HI. This is an artefact because >65% of the
cattle surveyed were beef cattle (finishers and suckler cows). Normal Hb levels
in beef cattle are significantly higher than in dairy cows but for general
assessment purposes the Grange computer is programmed for dairy cows; it flags
bovine Hb values >14.9 g/dL as high because it does not use separate
breakpoints for beef versus dairy cattle.
4b. Liver Cu status and animal
type: The three cattle types (dairy
cows, finishers and suckler cows) represent the main types of the adult bovine
population in the national herd. Mineral supplementation is more routine in
dairy cows than in beef cattle or suckler cows.
Table 8
shows the statistics and % samples low and high for liver Cu. It shows the
overall data classified by animal type and by slaughter season. Table
8a shows the liver Cu data classified by slaughter season by animal
type.
Pooled data for the two slaughter periods (the upper
part of Table
8) show that mean liver Cu status in dairy cows (243 mg/kg DM)
was higher than in finishers or suckler cows, which also were different from
each other (145 and 122 mg/kg DM, respectively, p<.01). Also, the percentage
of samples classed as "low + very low" (%LO) was lower in dairy cows (8.2%) than
in finishers or suckler cows (23.7 and 26.6%, respectively). High liver Cu
values were rare in dairy cows, finishers and suckler cows (0.56, 0.24 and
0.12%, respectively).
Liver Cu data classified by slaughter season (Table
8a) show an interaction between animal type and slaughter season.
However, they also show that dairy cows had higher levels (p<.001) than
suckler cows or finishers.
Liver Cu status and slaughter season: The two slaughter periods (autumn and spring) were selected to represent
the end of the grazing season and the end of the indoor feeding period,
respectively. Cattle fed indoors receive minerals supplementation more routinely
than cattle at pasture, especially from May-June onwards
Season had a significant effect on overall mean liver
Cu. Pooled data for the three animal types (the lower part of Table 8)
show that values were lower in autumn than in spring (130 and 210 mg/kg DM,
respectively, p<.001). Also, the percentage of samples classed as "low + very
low" (%LO) was higher in autumn than in spring (25.8 and 11.4%, respectively).
High liver Cu values were rare in autumn and spring (0.35, 0.26%,
respectively).
Liver Cu status, slaughter season and animal type:
Data classified by animal type (Table
8a) show that season had a significant effect on mean liver Cu in all
three animal types; autumn values were lower than spring values: dairy cows 211
versus 276 mg/kg DM, (p<.001); finishers 69 versus 221 mg/kg DM (p<.001);
suckler cows 110 versus 134 mg/kg DM (p<.001), respectively. Finishers had
the lowest autumn values (69 mg/kg DM).
Also, the percentage of samples classed as "low + very low"
(%LO) was higher in autumn than in spring in dairy cows (12.6 versus 2.8%) and
finishers (39.3 versus 7.1%), but not in suckler cows (27.3 versus 25.8%). High
liver Cu values were rare (<1%) in autumn and spring in any animal
type.
- The liver Cu data highlight the need
for increased input of Cu supplements at pasture, especially in beef
cattle and suckler cows.
|
4c. Blood Cu
status: Table 9
shows the statistics and % samples low and high for blood Cu. It shows the
overall data classified by animal type and by slaughter season. Table
9a shows the blood Cu data classified by slaughter season by animal
type.
Blood Cu status and animal type: Pooled data for the two slaughter periods (the upper part of
Table
9) show that mean blood Cu status in dairy cows (13.2 umol/L) was higher
(p<.001) than in finishers or suckler cows, which also were different from
each other (11.7 and 12.5 umol/L, respectively, p<.001). Also, the percentage
of samples classed as "low + very low" (%LO) was lower in dairy cows (4.6%) than
in finishers or suckler cows (11.8 and 10.9%, respectively). High blood Cu
values were rare in dairy cows, finishers and suckler cows (1.11, 0.12 and
0.47%, respectively).
Blood Cu data classified by slaughter season (Table
9a) show an interaction between animal type and slaughter season.
However, they also show that dairy cows had higher blood Cu levels (p<.001)
than suckler cows or finishers, except in the autumn comparison of dairy versus
suckler cows (13.2 and 12.9 umol/L, respectively, not significantly
different).
Blood Cu status and slaughter season:
Season had a significant effect on overall
mean blood Cu. Pooled data for the three animal types (the lower part of Table 9)
show that values were higher in autumn than in spring (12.63 and
12.29 umol/L, respectively, p<.001). This was unexpected, as the opposite
usually was the case in previous experimental observations. However, the
percentage of samples classed as "low + very low" (%LO) was higher in autumn
than in spring (10.8 and 6.7%, respectively). This was expected from previous
experimental observations. High blood Cu values were rare in autumn and spring
(0.56 and 0.60%, respectively).
Blood Cu status, slaughter season and animal type:
Blood Cu data classified by animal type (Table
9a) show an interaction between animal type and slaughter season. Season
had no significant effect on mean blood Cu in dairy cows (13.2 versus 13.1
umol/L, respectively) and finishers (11.8 versus 11.7 umol/L, respectively).
Also, the percentage of samples classed as "low + very low" (%LO) was higher in
autumn than in spring in dairy cows (5.8 versus 3.0%) and finishers (16.7 versus
6.4%).
However, suckler cows had higher blood Cu values in autumn than
in spring (12.9 versus 12.1 umol/L, respectively, p<.001) and their
percentage of samples classed as "low + very low" (%LO) was similar in autumn
and spring (10.7 versus 11.1%). This was unexpected, as in previous experimental
observations, autumn values for blood Cu usually were lower than spring values
and more critically low values usually occur in autumn. High blood Cu values
were rare (<1.2%) in autumn and spring in any animal type.
4c.1. Cu levels in liver versus whole blood in
the assessment of bovine Cu status
In the assessment of bovine Cu status, blood Cu
consistently underestimated the extent of LO (i.e. low+very low) status relative
to liver Cu. Relevant data from Tables 7,
8,
8a,
9 and
9a show
that same trend was present in most comparisons:
| |
Table
7 |
Table
8+9 |
Table
8+9 |
Table
8+9 |
Table
8+9 |
Table
8+9 |
Table
8a+9a |
Table
8a+9a |
|
|
All data |
All data |
All data |
All
data
|
Autumn
|
Spring
|
Autumn |
Spring |
|
LO Cu status based
on |
|
Liver Cu levels |
|
Blood Cu levels |
|
Discrepancy factor
(liver/blood) | |
|
|
|
|
|
|
|
Dai |
Fin |
Suc |
|
12.57 |
39.32 |
27.27 |
|
5.78 |
16.74 |
10.67 |
|
2.17 |
2.35 |
2.56 | |
|
Dai |
Fin |
Suc |
|
2.77 |
7.06 |
25.75 |
|
3.02 |
6.36 |
11.11 |
|
0.92 |
1.11 |
2.32 | |
Figure 1 shows a plot
of Cu levels in liver and whole blood for all samples (n=2574 matched pairs). Figure
1a shows a plot of Cu levels in a subset of the data with liver Cu
levels up to 50 mg/kg DM and whole blood for those samples (n=761 matched
pairs). The figures show that Cu levels in blood and liver were very poorly
related; it was impossible to predict a blood Cu level accurately from a given
liver Cu level.
Liver is a natural storage depot of Cu and other
trace elements. Elements stored physiologically in liver recycle back to the
blood, especially when the net absorption of those elements falls in times of
dietary scarcity (9).
Theoretically, blood Cu remains stable in cattle on Cu deficient diets, or those
whose diets contained Cu antagonists, until liver Cu reserves are exhausted,
after which blood Cu levels fall (10).
However, accurate assessment of Cu status in cattle is difficult (10). A
"normal" blood Cu level does not guarantee a "normal" liver Cu status because
the relationship between Cu levels in blood and liver is unpredictable (Figure
1), even at the lower levels of liver Cu (Figure
1a). As liver Cu reflects Cu status more accurately than blood Cu, those
who use blood Cu to assess Cu status in cattle should bear these facts in mind.
However, as liver biopsy seldom is a practical option in commercial herds, blood
tests usually are used for routine assessment of mineral status in live
cattle.
In summary, relative to liver levels, blood levels
underestimated the extent of low Cu status by a factor of >2, with a wide
range of error (0.9-2.6 times). To rectify this discrepancy, one might consider
raising the threshold for "low Cu status" >8.78 umol /L for
blood Cu, or lowering it <23 mg/kg DM for liver Cu. However,
because of the poor relationship between levels of Cu in blood and liver, there
is no easy solution to rectify this problem.
4d. Blood PII status: Table
10 shows the statistics and % samples low and high for blood PII. It
shows the overall data classified by animal type and by slaughter season.
Table
10a shows the blood PII data classified by slaughter season by animal
type.
Blood PII status and animal type: Pooled data for the two slaughter periods (the upper part of
Table
10) show mean blood PII status did not differ significantly between
dairy cows and finishers (58.2 and 58.1 ug/L). Both groups had marginally low
(deficient) PII. However, suckler cows had lower PII (44.2 ug/L, p<.001),
which was classed as low (deficient). Also, the percentage of samples classed as
"low + very low" (%LO) was high in all groups, but was higher in suckler cows
(77.2%) than in dairy cows and finishers (65.0 and 64.5%, respectively) in. High
PII values were rare in dairy cows, finishers and suckler cows (3.5, 4.6 and
4.0%, respectively).
PII data classified by slaughter season (Table
10a ) show an interaction between animal type and slaughter season.
Autumn values in dairy cows, finishers or suckler cows were similar to each
other and were consistently low (33, 28 and 31 ug/L, respectively). Spring PII
values in dairy cows and finishers were similar to each other and were
marginally low (83 and 88 ug/L, respectively), but these values were higher
(p<.001) than those in suckler cows (63 ug/L).
Blood PII status and slaughter
season: Season had a significant effect on
overall mean blood PII. Pooled data for the three animal types (the lower part
of Table
10) show that values were lower in autumn than in spring (31.0 and 78.1
ug/L, respectively, p<.001). Also, the percentage of samples classed as "low
+ very low" (%LO) was higher in autumn than in spring (83.7 and 51.1%,
respectively). High PII values were rare in autumn but more common in spring
(0.9 and 7.7%, respectively). PII rises and falls very rapidly depending on
increases or decreases of current I intake. The marked effect of season on PII
was probably due to absence of I supplementation in autumn relative to the
indoor feeding period.
Blood PII status, slaughter season and animal type:
PII data classified by animal type (Table
10a) show an interaction between animal type and slaughter season.
Season had a significant effect on mean blood PII in all three animal types;
autumn values were lower than spring values: dairy cows 33.0 versus 83.5 ug/L
(p<.001); finishers 28.4 versus 87.7 ug/L (p<.001); suckler cows 31.5
versus 63.0 ug/L (p<.001), respectively. Also, the percentage of samples
classed as "low + very low" (%LO) was higher in autumn than in spring in dairy
cows (80.5 versus 46.3%), finishers (84.2 versus 43.3%) and suckler cows (86.7
versus 65.0%). High blood PII values were rare (<2.1%) in autumn in any
animal type but occurred in 7.6, 8.8 and 6.5% of dairy cows, finishers and
suckler cows, respectively, in spring.
- The PII data highlight the need for
increased input of I supplements at pasture, in all types of cattle
(dairy cows, finishers and suckler cows.
|
4e. Blood GPx
status: Table
11 shows the statistics and % samples low and high for blood GPx. It
shows the overall data classified by animal type and by slaughter season.
Table
11a shows the blood GPx data classified by slaughter season by animal
type.
Blood GPx status and animal type: Pooled data for the two slaughter periods (the upper part of
Table
11 ) show that mean blood GPx status in dairy cows (85.7 iu/g Hb) was
higher (p<.001) than in finishers or suckler cows, which also were different
from each other (80.5 and 67.3 iu/g Hb, respectively, p<.001). Also, the
percentage of samples classed as "low + very low" (%LO) was lower in dairy cows
(6.3%) than in finishers or suckler cows (9.1 and 17.3%, respectively). High
blood GPx values were rare in dairy cows, finishers and suckler cows (1.6, 1.6
and 1.0%, respectively).
GPx data classified by slaughter season (Table
11a) show an interaction between animal type and slaughter season.
Autumn values in dairy cows (77 iu/g Hb) were higher (p<.001) than in
finishers or suckler cows (62 and 61 iu/g Hb, respectively). Spring values in
dairy cows and finishers were similar (94 and 99 iu/g Hb, not significantly
different), but these values were higher (p<.001) than in suckler cows (75
iu/g Hb).
Blood GPx status and slaughter season (late spring
versus late autumn): Season had a significant
effect on overall mean blood GPx. Pooled data for the three animal types (the
lower part of Table
11) show that values; values were lower in autumn than in spring (66.7
and 89.0 iu/g Hb, respectively, p<.001). Also, the percentage of samples
classed as "low + very low" (%LO) was higher in autumn than in spring (16.3 and
4.2%, respectively). High blood GPx values were rare in autumn and spring (1.81
and 0.87%, respectively).
Blood GPx status, slaughter season and animal type:
GPx data classified by animal type (Table
11a) show an interaction between animal type and slaughter season.
Season had a significant effect on mean blood GPx in all three animal types;
autumn values were lower than spring values: dairy cows 77.1 versus 94.3 iu/g Hb
(p<.001); finishers 62.4 versus 98.6 iu/g Hb (p<.001); suckler cows 60.7
versus 74.2 iu/g Hb (p<.001), respectively. Also, the percentage of samples
classed as "low + very low" (%LO) was higher in autumn than in spring in dairy
cows (9.5 versus 2.3%), finishers (16.6 versus 1.2%), and suckler cows (23.0
versus 9.7%). High blood GPx values were rare (<2.3%) in autumn and spring in
any animal type.
- The blood GPx data highlight the need
for increased input of Se supplements at pasture, especially in beef
cattle and suckler cows.
|
4f. Blood Hb
status: Table
12 shows the statistics and % samples low and high for blood Hb. It
shows the overall data classified by animal type and by slaughter season.
Table
12a shows the blood Hb data classified by slaughter season by animal
type.
Blood Hb status and animal type: Pooled data for the two slaughter periods (the upper part of
Table
12) show mean blood Hb status in dairy cows (12.2 g/dL) was lower
(p<.001) than in finishers or suckler cows, which also were different from
each other (14.0 and 12.8 g/dL, respectively, p<.001). Also, the percentage
of samples classed as "low + very low" (%LO) was higher in dairy cows (12.0%)
than in finishers or suckler cows (1.8 and 8.1%, respectively). High Hb values
were especially common in finishers and suckler cows (28.3 and 18.9%,
respectively). As discussed below, dairy cows normally have lower Hb levels than
finishers or suckler cows. Therefore, these differences in Hb have little
significance as regards bovine health.
Hb data classified by slaughter season (Table
12a ) show an interaction between animal type and slaughter season.
Autumn values were highest in finishers, intermediate in suckler cows and lowest
in dairy cows (14.0, 13.1 and 11.9 g/dL, respectively; all differences
significant at p<.001). Autumn values were highest in finishers (14.1 g/dL)
but dairy and suckler cows had similar values (12.5 and 12.4 g/dL, respectively,
not significantly different from each other).
Blood Hb status and slaughter season:
Season had no significant effect on overall
mean blood Hb. Pooled data for the three animal types (the lower part of Table
12) show that values did not differ significantly in autumn and in
spring (13.0 and 13.0 g/dL, respectively), and the percentage of samples classed
as "low + very low" (%LO) were similar (7.4 and 7.3%, respectively). This was
unexpected, as Hb levels usually are lower at the start of the grazing season
than those at the end of the grazing season. High blood Hb values were common in
autumn and spring (17.6 and 19.8%, respectively). As discussed below, this can
be ignored as an artefact because >65% of the cattle surveyed were beef
cattle (finishers and suckler cows), which normally have higher Hb levels than
dairy cows.
Blood Hb status, slaughter season and animal type:
Data classified by animal type (Table
12a) show a complex interaction between animal type and slaughter
season. Dairy cows had lower Hb in autumn than in spring (11.9 and 12.5 g/dL,
respectively; p<.001). The reverse applied to suckler cows (autumn 13.1,
spring values were 13.1 and 12.4 g/dL, respectively; p>.001). Autumn and
spring values in finishers (14.0 and 14.1 g/dL, respectively) did not differ
significantly.
Anomaly in the Hb status of suckler
cows: Typically, suckler cows have Hb values
>1.5 g/dL higher than dairy cows. However, suckler cows had identical values
to dairy cows in late winter (near turnout) in this survey (12.4 versus 12.5
g/dL, respectively, Table
12a). This suggests that suckler cows had a relative (mild) anaemia in
winter; this may deserve further investigation.
4g. Relationships between GPx levels in blood and
selenium levels in liver and kidney
Figure 2 shows
the relationships between blood GPx and Se levels in kidney & liver. Figure
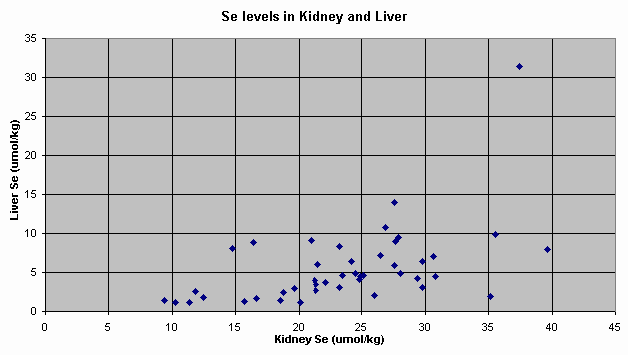
3 shows the relationship between Se levels in liver and kidney.
The relationships between blood GPx, liver Se and kidney Se levels within 44
sets of matched samples were established by regression analysis.The regression
equations were:
| |
|
N (pairs) |
R2 |
Significance |
|
Kidney Se = |
Blood GPx*0.035 + 20.06 |
44 |
0.109 |
p>.05 |
|
Liver Se = |
Blood GPx*0.050 - 0.668 |
44 |
0.443 |
p<.001 |
|
Liver Se = |
Kidney Se*0.362 - 2.95 |
44 |
0.264 |
p <.001 |
The data, above, show that blood GPx and Se levels in
bovine kidney and liver had positive linear relationships but predictability
very poor [R2 = 0.109]. The relationship between blood GPx and liver
Se was better [R2 = 0.443] but still had a wide degree of
unpredictability. Se levels in liver and kidney had a positive linear
relationship but predictability was poor [R2 = 0.264]. Also, liver Se
correlated better with blood GPx (R2 = 0.443) than with kidney Se
(R2 = 0.264). Grange adopts blood GPx levels of 40-169 iu/g Hb as the
normal range for individual cattle. From the GPx equations above, the
corresponding normal range of Se in liver is 3.7-9.1 umol/kg; and in kidney is
22.1-26.0 umol/kg (based on GPx), or 18.3-33.3 umol/kg (based on the calculated
"normal" liver values of 3.7-9.1 umol/kg). However, there is very wide variation
around those values, especially the kidney values.
4.h Risk of trace element toxicity to
cattle or humans
The highest levels of Cu, GPx or PII recorded in the
data posed no risk of toxicity to cattle. Because human dietary trace element
recommendations are somewhat confusing, they are discussed separately,
below.
Copper:
Gastrointestinal disturbances (nausea, vomiting and abdominal cramps)
have occurred at daily Cu intakes of 2-32 mg from contaminated water.
Cu in drinking water should not exceed 2 mg/L; otherwise, there are
few data to suggest an upper safe limit of Cu intake for humans (12).
Recent American data recommend an adult Cu intake of 0.9 mg/d; Americans ingest
a mean of 1.0-1.6 mg/d but can tolerate up to 10 mg/d (13).
Overall mean liver Cu level in the survey was 167 mg/kg DM.
Assuming that liver has 30% DM, adults would need to consume 200 g liver/d to
exceed the tolerable Cu intake from that source.
Only 8/2587 liver samples had high Cu levels (>799 mg/kg DM,
actual range 800-1347 mg/kg DM). Ingestion of 25-42 g liver/d with those Cu
levels would exceed the human adult tolerable Cu intake (10
mg/d).
Selenium: Data on
chronic toxicity of natural Se in humans are scarce (14). In
America and Canada, the recommended adult Se intake is 55 ug/d and mean intake
is 81-220 ug/d (15). The
maximum daily safe intake suggested is 300-400 ug (0.3-0.4 mg) Se/d (14, r1615);
natural Se intakes >5 ug/kg LW/d over a long period should be avoided (14).
Marginal biochemical changes occurred in two subjects at intakes of 200-400 ug
Se/d from Se-containing yeast; biochemical changes occurred at
dietary Se intakes >750 ug/d; >750-850 ug Se/d are undesirable and
clinical signs of human Se toxicity occurred at intakes of 0.9-5.0 mg Se/d (12, 16).
Overall mean blood GPx level in the survey was 76.7 iu/g Hb.
Using the regression lines established between blood GPx and liver and kidney,
that GPx level corresponds with levels of 360 and 1640 ug Se/kg in liver and
kidney, respectively. To exceed a daily intake of 400 ug Se from liver or
kidney, humans would need to eat >1111 or >244 g of liver or kidney/d,
respectively.
Only 35/2587 blood samples had high GPx levels (>169 iu/g Hb,
mean 191 (range 171-250) iu/g Hb). Those high GPx levels correspond with
mean levels of 810 (range 730-1020) and 2870 (range 2650-3500) ug Se/kg in liver
and kidney, respectively. Ingestion of 494 (range 392-548) or 139 (114-151) g/d,
respectively, of liver or kidney with those Se levels would exceed the upper Se
intake recommended (400 ug Se/d).
Iodine: In
America, the recommended adult I intake is 150 ug/d and mean intake is 190-360
ug/d (13).
Although most healthy human adults tolerate intakes up to 1100 ug (1.1 mg)/d (12, 13),
susceptible subgroups may develop goitre and/or hypothyroidism or
excessive thyroid activity at intakes of 300-1000 ug/d (12).
Overall mean PII level in the survey was 58.2 ug/L. Assuming
that milk has similar I levels to PII, adults would need to consume >18.9 l
milk/d to exceed the tolerable I intake (1100 ug/d) from that source.
Although 104/2595 samples had high PII (>300 ug/L), normal
adults would need to consume >3.3 l of such milk/d to exceed the tolerable I
intake, but susceptible adults would need to keep their milk consumption <1
l/d to be safe.
- In summary, even the highest
levels of Cu, GPx and PII recorded in the survey pose minimal or no risk
of toxicity to cattle, or to the human food chain.
|
5.
OVERALL CONCLUSIONS
- Current national inputs of Cu, I and Se do not pose a threat
of toxicity to cattle, or to the human food chain. However, current inputs are
inadequate to maintain normal trace element status in finished steers and cull
cows, especially beef cows, at slaughter.
- Cattle at risk of trace element deficiencies include all
dairy- and suckler- cows, and beef animals fed unsupplemented forages
(pasture, silage, hay or straw).
Adequate oral supplementation returns low status
of Cu, Se or I in bovine blood to normal, but I deficiency was the most
prevalent mineral deficiency; 69% of all cattle tested had low I status. I
deficiency is the most important trace element problem to be addressed in the
Irish national herd. PII levels become normal within hours of adequate I
supplementation, but fall to control values within 4-15 days of withdrawal of
the supplement. Therefore, an I supplement must be given very regularly to
maintain normal PII in I deficient cattle (6).
In contrast, recyclng can maintain blood levels of Cu and GPx for weeks or
months after Cu and Se supplements are withdrawn (5,
11).
Liver Cu reflects Cu status more accurately than blood Cu,
which underestimates the extent of Cu deficiency in cattle by a factor of
>2, with a wide range of error (0.9-2.6 times). However, as liver biopsy
seldom is a practical option in commercial herds, blood tests usually are used
for routine assessment of mineral status in live cattle.
6. ACKNOWLEDGEMENTS
Dr. David Poole started research on trace element deficiency in
cattle in the mid 1960s. After his retirement in 1989, I expanded on his work. I
thank him for 25 years of sound guidance and training and for being a most
helpful and friendly supervisor and mentor.
Many colleagues helped in this project. I thank Peter McCann,
Francis Collier, Joe Farrell, Hugh Larkin, Joe Larkin, Mary Munnelly, Joe Munroe, Dan Prendeville and Julianne Price
(Grange Research Centre) for skilled technical and/or
laboratory help, Dr. James McLaughlin and his staff at the Biochemistry
Department, Veterinary Research Laboratory, Abbotstown, Castleknock, Dublin for
the selenium analyses on liver and kidney, and Tony Hegarty (HQ) and Aidan
Moloney (Grange) for statistical analysis of the data.
I also thank the Floor Managers, veterinary- and general- staff
of the abattoirs at Ballyhaunis, Ballyjamesduff, Bandon, Charleville, Clonmel,
Freshford, Longford, Rathkeale and Watergrasshill for wholehearted cooperation
during the collection of the tissue samples.
7. REFERENCES &
PUBLICATIONS
- Rogers PAM (1989) Composition of
cattle and sheep mineral/vitamin mixes on the Irish market. Annual
Research Report, Grange Research Centre, p115) and Rogers PAM (1990) The
Cost and Composition of Cattle and Sheep Mineral/Vitamin Mixes on the Irish
Market. Teagasc Bulletin. Issued to Nutritionists in the Mineral Mix/Feed
Compounding trade, 18pp.
- Rogers PAM & Murphy WE (1999)
Dry matter, major elements & trace elements in Irish grass, silage &
hay. Teagasc Grange Webpages at 0forage.htm
- Poole DBR & Rogers PAM
(1970-1987) Data from early surveys by the Field Investigations
Department, Dunsinea Research Centre
- Mee JF, Rogers PAM, Drennan M.J,
O'Farrell KJ & Murphy J (1996). Trace element supplementation in dairy and
suckler cows. Report of Teagasc Animal Health Committee. 17 pp.
- Rogers PAM & Mee JF (1996) Trace
element supplementation of cows. Part 1: Effects of oral copper, selenium
and iodine supplements on tissue status. World Buiatrics Congress, Edinburgh,
July 8-12.
- Rogers PAM (1999) Iodine
supplementation of cattle. End of Project Report: Project No. 4381, Grange
Research Centre, Dunsany, Co. Meath, Ireland, Dec 1999. Supported by the
European Union Structural Funds (EAGGF), 36 pp. i_report.htm
- Rogers PAM (1997) A survey of
blood mineral status in Irish cattle and sheep. Annual Research Report, Grange
Research Centre. p29.
- Rogers PAM (2000) A survey of
blood mineral status in Irish cattle and sheep. Annual Research Report,
Grange Research Centre. In press.
- Blincoe,C. (1993) Computer simulation of bovine copper metabolism. J Agr Sci 1993
AUG;121(Part 1):91-96
- Radostits OM, Blood DC & Gay CC
(1994) Veterinary Medicine: A textbook of the diseases of cattle sheep, pigs,
goats and horses. 8th Edition, Balliere Tyndall, 1763 pp (see p
1388).
- Mee JF, Rogers PAM & O'Farrell
KJ (1995) Effect of feeding a mineral-vitamin supplement before calving on
the calving performance of a trace element deficient dairy herd. Veterinary
Record 137, 508-512.
- Sandström B (1998) Toxicity
Considerations when revising the Nordic Nutrition Recommendations. Journal
of Nutrition Vol. 128 No. 2 February, pp. 372S-374S.
- Schrey P, Wittsiepe J, Budde U,
Heinzow B, Idel H & Wilhelmn M (2000) Dietary intake of lead, cadmium,
copper and zinc by children from the German North Sea island Amrum.
International Journal of Hygiene and Environmental Health 203 (1): 1-9.
- Yang G, Yin S, Zhou R, Gu L, Yan B,
Liu Y, Liu Y (1989) Studies of safe maximal daily dietary Se-intake in a
seleniferous area in China. Part II: Relation between Se-intake and the
manifestation of clinical signs and certain biochemical alterations in blood
and urine. J Trace Elem Electrolytes Health Dis 3(3):123-30. Erratum in: J
Trace Elem Electrolytes Health Dis Dec;3(4):250.
- Zimmerli B, Haldimann M & Sieber
R (1997) Selenium status of the Swiss population: 1. Biological effects,
requirement and toxicity of selenium. Mitteilungen aus dem Gebiete der
Lebensmitteluntersuchung und Hygiene 88:6;732-754.
- Sandström B (2001) Update on
recommended and maximum tolerable human intakes of copper, iodine and
selenium. Research Department of Human Nutrition, Royal Veterinary and
Agricultural University, DK-1958 Frederiksberg C, Copenhagen, Denmark Personal
communication, June 19th.
8.
TABLES AND FIGURES
T
1 Mean supplementation rates of minerals from
Irish mineral mixes in 1989-90
T
2 Percentage of forage samples with major
element levels at undesirable levels for dairy cows
T
3 Percentage of forage samples with trace
element levels at undesirable levels for dairy cows
T
4 Numbers of test results used for
statistical analysis of the abattoir survey
T
5 Format of the data presented for
statistical analysis
T
6 Breakpoints used to classify individual
animal mineral status into 5 groups
T
7 Overall statistics for liver Cu and blood
Cu, GPx, haemoglobin (Hb) and PII
T
8 Statistics for liver Cu (mg/kg DM) by
animal type and by season
T
8a Statistics for liver Cu (mg/kg DM) by slaughter season
by animal type
T
9 Statistics for blood Cu (umol/L) by animal
type and by season
T
9a Statistics for blood Cu (umol/L) by slaughter season
by animal type
T
10 Statistics for blood PII (ug/L) by animal type and by
season
T
10a Statistics for blood PII (ug/L) by slaughter season by animal
type
T
11 Statistics for blood GPx (iu/g Hb) by animal type and
by season
T
11a Statistics for blood GPx (iu/g Hb) by slaughter season by animal
type
T
12 Statistics for blood Hb (g/dL) by animal type and by
season
T
12a Statistics for blood Hb (g/dL) by slaughter season by animal
type
F
1 Plot of Cu levels in liver and whole blood
(all samples)
F
1a Plot of Cu levels in liver up to 50 mg/kg DM and those
in blood
F
2 Relationships between blood GPx and Se
levels in liver and kidney
F
3
Relationships between Se levels in liver and kidney.
Table
1. Mean supplementation rates of major (Ca, P, Mg, Na g/d) and trace (Cu, Se, I,
Mn, Zn, Co mg/d) elements from Irish mineral mixes in
1989-90.
|
|
Ca |
P |
Mg |
Na |
Cu |
Se |
I |
Mn |
Zn |
Co |
|
Cows - dairy |
19.0 |
12.4 |
5.3 |
9.6 |
143 |
1.63 |
44 |
492 |
488 |
20.0 |
|
Cows - sucklers |
16.4 |
8.6 |
5.8 |
8.8 |
125 |
1.09 |
32 |
367 |
232 |
12.7 |
|
Cows in tetany
season |
6.8 |
2.9 |
25.8 |
9.1 |
216 |
1.83 |
39 |
339 |
344 |
12.9 |
|
Cows postpartum |
18.1 |
11.8 |
6.2 |
11.1 |
217 |
2.75 |
44 |
460 |
456 |
15.9 |
|
Cows prepartum |
6.4 |
10.7 |
8.3 |
13.6 |
174 |
2.04 |
38 |
434 |
363 |
15.7 |
|
Cows unspecified |
10.7 |
8.3 |
6.2 |
11.3 |
170 |
1.43 |
34 |
333 |
288 |
11.9 |
|
Finishers |
14.6 |
7.7 |
4.1 |
10.2 |
136 |
1.54 |
30 |
296 |
289 |
12.8 |
Table 2. The % forage samples with major element levels at undesirable
levels for dairy cows. Reference ranges and undesirable levels for N, K, Mg and
S levels are underlined in bold font below (Parle et al
1993).
|
|
(c) N |
(c) K |
(a) Mg |
(c) S |
|
Reference Range (%
DM) |
2.5-3.1 |
0.5-3.1 |
.20-.33(a) |
.20-.30 |
|
Undesirable level (%
DM) |
>3.1 |
>3.1 |
<.20 |
>0.3 |
|
Undesirable Grass
% |
65.1 |
31.6 |
49.1 |
80.5 |
|
Undesirable Silage
% |
7.0 |
10.7 |
67.3 |
45.1 |
Table 3. The % forage samples with trace
element levels at undesirable levels for dairy cows. Reference ranges and
undesirable levels for trace element levels are underlined in bold font
below (Parle et al 1993).
|
|
(b) Cu |
(c) Mo |
(b) Se |
(b) I |
(b) Zn |
(b) Mn |
(b) Co |
|
Reference Range (ppm DM) |
(a) 10-33 |
<2.0 |
.231-.620 |
0.8-2.0+ |
25-250 |
25-250 |
.10-1.0 |
|
Undesirable level (ppm DM) |
<10.0 |
>2.0 |
<.081 <.24 |
<0.8 |
<25 |
<25 |
<.10 |
|
Undesirable Grass % |
65.4 |
42.1 |
71.9 92.9 |
97.1 |
24.5 |
2.2 |
11.1 |
|
Undesirable Silage % |
64.8 |
20.8 |
69.0 94.4 |
98.2 |
35.3 |
.7 |
- |
(a)
Higher
levels may be needed in the face of severe challenge to Mg, Cu or I
status
(b)
Low levels
indicate that high producing herds may need these supplements.
(c)
High N and K
can reduce the availability of many minerals to cows. High Mo and S reduce Cu
absorption by cows. Though Zn is marginal in 25-35% of green forages, clinical
herd histories and analysis of bovine blood indicated that Zn deficiency is very
rare in cattle. Mn deficiency in Irish herds is almost unknown.
Table 4. Numbers of test results
used for statistical analysis of the abattoir survey
|
|
Liver Cu |
Blood Cu |
Blood GPx |
Blood Hb |
Plasma PII |
|
Dairy cows |
|
|
|
|
|
|
Ex grass |
501 |
502 |
485 |
485 |
491 |
|
ex sheds |
397 |
398 |
391 |
391 |
406 |
|
Total |
898 |
900 |
876 |
876 |
897 |
|
Finishers |
|
|
|
|
|
|
ex grass |
440 |
442 |
429 |
429 |
442 |
|
ex sheds |
411 |
409 |
409 |
409 |
411 |
|
Total |
851 |
851 |
838 |
837 |
853 |
|
Suckler cows |
|
|
|
|
|
|
ex grass |
473 |
478 |
470 |
470 |
474 |
|
ex sheds |
365 |
369 |
349 |
349 |
371 |
|
Total |
838 |
847 |
819 |
819 |
845 |
|
All cattle |
|
|
|
|
|
|
ex grass |
1414 |
1422 |
1384 |
1384 |
1407 |
|
ex sheds |
1173 |
1176 |
1149 |
1149 |
1188 |
|
Grand Total |
2587 |
2598 |
2533 |
2533 |
2595 |
Table 5. Format of the data
presented for statistical analysis
|
Col |
Var |
Value |
|
1 |
Type |
Animal Type (D=Dairy cull cow; F=Finished
steer; S=Suckler cull cow |
|
2 |
A/S |
Season (A=slaughtered off grass in late autumn;
S=slaughtered out of sheds in late spring) |
|
3 |
Cu |
Whole blood copper value
(umol/L) |
|
4 |
GPx |
Whole blood glutathione peroxidase value (iu/g
Hb) |
|
5 |
Hb |
Whole blood haemoglobin value
(g/dL) |
|
6 |
I |
Plasma inorganic iodine value
(ug/L) |
|
7 |
Liv_Cu |
Liver copper value (mg/kg
DM) |
|
8 |
Cu_R |
Whole blood copper ranking (1=very low, 2=low,
3=marginal, 4=normal, 5=high) |
|
9 |
GPx_R |
Whole blood glutathione peroxidase ranking
(1=very low, 2=low, 3=marginal, 4=normal, 5=high) |
|
10 |
Hb_R |
Whole blood haemoglobin ranking (1=very low,
2=low, 3=marginal, 4=normal, 5=high) |
|
11 |
I_R |
Plasma inorganic iodine ranking (1=very low,
2=low, 3=marginal, 4=normal, 5=high) |
|
12 |
LCu_R |
Liver copper ranking (1=very low, 2=low,
3=marginal, 4=normal, 5=high) |
Table 6. Breakpoints used to
classify the mineral status of individual animals**
|
Test and
classification* |
Unit |
VL |
LO |
ML |
NL |
HI |
|
Liver Cu |
mg/kg DM |
<15 |
15.1-23.1 |
23.2-30 |
31-800 |
>800 |
|
Blood Cu |
umol/L |
< 6.42 |
6.43-8.78 |
8.79-10.19 |
10.2-20.4 |
>20.4 |
|
PII |
ug/L |
<20 |
21-51 |
52-100 |
101-300 |
>300 |
|
Blood GPx |
iu/g Hb |
<24.5 |
24.6-32 |
33-40 |
41-169 |
>169 |
|
Blood Hb |
g/dL |
<8.1 |
8.1-9.4 |
9.5-10.6 |
10.7-14.9 |
>14.9 |
* VL=very low, LO=low, ML=marginal, NL=normal and
HI=high.
** Production responses to mineral supplements are
likely only when productivity is depressed and when herd mineral status
is low or very low. Marginal status suggests that supplementation is not fully
adequate but additional supplementation is unlikely to improve animal
performance.
Table 7. Overall counts (n),
standard errors (se), coefficients of variation (CV%) and means (X) for liver Cu
and blood Cu, and blood PII, GPx and Hb. The percentages of samples classified
as "Very low or Low" (%LO) and "High" (%HI) are also shown.
|
|
n |
se |
CV% |
X |
%LO* |
%HI |
|
Liver Cu (mg/kg DM) |
2587 |
3.051 |
82.80 |
167.03 |
19.29 |
0.31 |
|
Blood Cu (umol/L) |
2598 |
0.054 |
21.19 |
12.44 |
8.97 |
0.58 |
|
Blood PII (ug/L) |
2595 |
1.421 |
123.8 |
54.03 |
68.79 |
4.01 |
|
Blood GPx (iu/g Hb) |
2533 |
0.757 |
44.91 |
76.97 |
10.78 |
1.38 |
|
Blood Hb (g/dL) |
2533 |
0.046 |
16.33 |
13.00 |
7.35 |
18.6 |
* Non-clinical trace element deficiency is common.
Production responses to mineral supplements are likely only when productivity is
depressed and when herd mineral status is low or very
low.
Table 8. Liver Cu
(mg/kg DM) by animal type and by season: counts (n), standard errors
(se), means (X) and least significant difference (LSD). The percentages of
samples classified as "Very low or Low" (%LO) and "High" (%HI) are also
shown.
|
|
n |
se |
X* |
%LO |
%HI |
|
Dairy |
898 |
4.708 |
243.33a |
8.24 |
0.56 |
|
Finisher |
851 |
5.257 |
144.76b |
23.74 |
0.24 |
|
Suckler |
838 |
4.878 |
122.11c |
26.61 |
0.12 |
|
LSD |
|
|
14.92 |
|
|
|
|
|
|
|
|
|
|
Autumn |
1414 |
3.733 |
130.1a |
25.81 |
0.35 |
|
Spring |
1173 |
4.333 |
210.0b |
11.42 |
0.26 |
|
LSD |
|
|
12.26 |
|
|
* Means with differing superscripts differ
significantly from each other
Table 8a. Liver Cu (mg/kg DM) by
slaughter season by animal type: overall counts (n), standard errors (se), means
(X) and least significant difference (LSD). The percentages of samples
classified as "Very low or Low" (%LO) and "High" (%HI) are also
shown.
|
Liver Cu
|
Dairy
|
n |
se |
X |
|
501 |
6.182 |
211.10a |
|
397 |
7.111 |
275.57b |
|
|
|
20.11 | |
Finisher
|
n |
se |
X |
|
440 |
6.812 |
68.79b |
|
411 |
8.008 |
220.73c |
|
|
|
22.65 | |
Suckler
|
n |
se |
X |
|
473 |
6.386 |
110.44d |
|
365 |
7.375 |
133.78e |
|
|
20.86 | |
|
Dairy
|
%LO |
%HI |
|
12.57 |
0.80 |
|
2.77 |
0.25 |
|
| |
Finisher
|
%LO |
%HI |
|
39.32 |
0.00 |
|
7.06 |
0.49 |
|
| |
Suckler
|
%LO |
%HI |
|
27.27 |
0.21 |
|
25.75 |
0.00 |
|
| |
* Means with differing superscripts in the same
column or row differ significantly from each other
Table 9. Blood Cu (umol/L) by animal type and by
season: counts (n), standard errors (se), means (X) and least significant
difference (LSD). The percentages of samples classified as "Very low or Low"
(%LO) and "High" (%HI) are also shown.
|
|
n |
se |
X* |
%LO |
%HI |
|
Dairy |
900 |
0.090 |
13.16a |
4.56 |
1.11 |
|
Finisher |
851 |
0.100 |
11.70b |
11.75 |
0.12 |
|
Suckler |
847 |
0.092 |
12.51c |
10.86 |
0.47 |
|
LSD |
|
|
0.28 |
|
|
|
|
|
|
|
|
|
|
Autumn |
1422 |
0.071 |
12.63a |
10.83 |
0.56 |
|
Spring |
1176 |
0.082 |
12.29b |
6.72 |
0.60 |
|
LSD |
|
|
0.23 |
|
|
* Means with differing superscripts differ
significantly from each other
Table 9a. Blood Cu (umol/L) by
slaughter season by animal type: overall counts (n), standard errors (se), means
(X) and least significant difference (LSD). The percentages of samples
classified as "Very low or Low" (%LO) and "High" (%HI) are also
shown.
|
Blood
Cu
|
Dairy
|
n |
se |
X |
| 502 |
0.118 |
13.22a |
| 398 |
0.135 |
13.10a |
|
|
0.38 | |
Finisher
|
n |
se |
X |
| 442 |
0.13 |
11.75b |
| 409 |
0.153 |
11.65b |
|
|
0.43 | |
Suckler
|
n |
se |
X |
| 478 |
0.121 |
12.90ac |
| 369 |
0.14 |
12.12d |
|
|
0.40 | |
|
Dairy
|
%LO |
%HI |
|
5.78 |
1.00 |
|
3.02 |
1.26 |
|
| |
Finisher
|
%LO |
%HI |
|
16.74 |
0.23 |
|
6.36 |
0.00 |
|
| |
Suckler
|
%LO |
%HI |
|
10.67 |
0.42 |
|
11.11 |
0.54 |
|
| |
* Means with differing superscripts differ
significantly from each other
Table 10. Blood PII (ug/L) by animal type and by season: counts
(n), standard errors (se), means (X) and least significant difference (LSD). The
percentages of samples classified as "Very low or Low" (%LO) and "High" (%HI)
are also shown.
|
|
n |
se |
X* |
%LO |
%HI |
|
Dairy |
897 |
2.274 |
58.20a |
64.99 |
3.46 |
|
Finisher |
853 |
2.540 |
58.10a |
64.48 |
4.57 |
|
Suckler |
845 |
2.343 |
44.22b |
77.16 |
4.02 |
|
LSD |
|
|
7.18 |
|
|
|
|
|
|
|
|
|
|
Autumn |
1407 |
1.808 |
30.96a |
83.72 |
0.92 |
|
Spring |
1188 |
2.082 |
78.06b |
51.09 |
7.66 |
|
LSD |
|
|
5.89 |
|
|
* Means with differing superscripts differ
significantly from each other
Table 10a. Blood PII (ug/L) by
slaughter season by animal type: overall counts (n), standard errors (se), means
(X) and least significant difference (LSD). The percentages of samples
classified as "Very low or Low" (%LO) and "High" (%HI) are also
shown.
|
PII
|
Dairy
|
n |
se |
X |
|
491 |
3.020 |
32.96a |
|
406 |
3.400 |
83.45b |
|
|
|
9.62 | |
Finisher
|
n |
se |
X |
|
442 |
3.289 |
28.45a |
|
411 |
3.871 |
87.75b |
|
|
|
10.95 | |
Suckler
|
n |
se |
X |
|
474 |
3.082 |
31.47a |
|
371 |
3.531 |
62.98c |
|
|
9.99 | |
|
Dairy
|
%LO |
%HI |
| 80.45 |
0.00 |
| 46.31 |
7.64 |
|
| |
Finisher
|
%LO |
%HI |
| 84.16 |
0.68 |
| 43.31 |
8.76 |
|
| |
Suckler
|
%LO |
%HI |
|
86.71 |
2.11 |
|
64.96 |
6.47 |
|
| |
* Means with differing superscripts in the same
column or row differ significantly from each other
Table 11. Blood GPx (iu/g Hb) by animal type and by season:
counts (n), standard errors (se), means (X) and least significant difference
(LSD). The percentages of samples classified as "Very low or Low" (%LO) and
"High" (%HI) are also shown.
|
|
n |
se |
X* |
%LO |
%HI |
|
Dairy |
876 |
1.192 |
85.71a |
6.28 |
1.60 |
|
Finisher |
838 |
1.318 |
80.49b |
9.07 |
1.55 |
|
Suckler |
819 |
1.243 |
67.34c |
17.34 |
0.98 |
|
LSD |
|
|
3.73 |
|
|
|
|
|
|
|
|
|
|
Autumn |
1384 |
0.941 |
66.72a |
16.26 |
1.81 |
|
Spring |
1149 |
1.098 |
89.04b |
4.18 |
0.87 |
|
LSD |
|
|
3.11 |
|
|
* Means with differing superscripts differ
significantly from each other
Table 11a. Blood GPx (iu/g Hb) by
slaughter season by animal type: overall counts (n), standard errors (se), means
(X) and least significant difference (LSD). The percentages of samples
classified as "Very low or Low" (%LO) and "High" (%HI) are also
shown.
|
GPx
|
Dairy
|
n |
se |
X |
|
485 |
1.570 |
77.10a |
|
391 |
1.793 |
94.32b |
|
|
|
5.07 | |
Finisher
|
n |
se |
X |
|
429 |
1.715 |
62.37c |
|
409 |
2.002 |
98.60bd |
|
|
|
5.66 | |
Suckler
|
n |
se |
X |
|
470 |
1.599 |
60.68c |
|
349 |
1.905 |
74.19e |
|
|
5.39 | |
|
Dairy
|
%LO |
%HI |
| 9.48 |
2.27 |
| 2.30 |
0.77 |
|
| |
Finisher
|
%LO |
%HI |
|
16.55 |
1.40 |
|
1.22 |
1.71 |
|
| |
Suckler
|
%LO |
%HI |
|
22.98 |
1.70 |
|
9.74 |
0.00 |
|
| |
* Means with differing superscripts in the same
column or row differ significantly from each other
Table 12. Blood Hb (g/dL) by animal type and by season: counts
(n), standard errors (se), means (X) and least significant difference (LSD). The
percentages of samples classified as "Very low or Low" (%LO) and "High" (%HI)
are also shown.
|
|
n |
se |
X* |
%LO |
%HI |
|
Dairy |
876 |
0.073 |
12.20a |
11.99 |
9.02 |
|
Finisher |
838 |
0.081 |
14.01b |
1.79 |
28.29 |
|
Suckler |
819 |
0.076 |
12.77c |
8.06 |
18.93 |
|
LSD |
|
|
0.23 |
|
|
|
|
|
|
|
|
|
|
Autumn |
1384 |
0.058 |
13.01a |
7.37 |
17.63 |
|
Spring |
1149 |
0.067 |
12.98a |
7.31 |
19.76 |
|
LSD |
|
|
0.19 |
|
|
* Means with differing superscripts differ
significantly from each other
Table 12a. Blood Hb (g/dL) by
slaughter season by animal type: overall counts (n), standard errors (se), means
(X) and least significant difference (LSD). The percentages of samples
classified as "Very low or Low" (%LO) and "High" (%HI) are also
shown.
|
GPx
|
Dairy
|
n |
se |
X |
|
485 |
0.096 |
11.92a |
|
391 |
0.110 |
12.49b |
|
|
|
0.31 | |
Finisher
|
n |
se |
X |
|
429 |
0.105 |
13.96c |
|
409 |
0.123 |
14.05c |
|
|
|
0.35 | |
Suckler
|
n |
se |
X |
|
470 |
0.098 |
13.14d |
|
349 |
0.117 |
12.40be |
|
|
0.33 | |
|
Dairy
|
%LO |
%HI |
| 12.37 |
6.60 |
| 11.51 |
12.02 |
|
| |
Finisher
|
%LO |
%HI |
|
3.26 |
27.97 |
|
0.24 |
28.61 |
|
| |
Suckler
|
%LO |
%HI |
|
5.96 |
19.57 |
|
10.89 |
18.05 |
|
| |
* Means with differing superscripts in the same
column or row differ significantly from each other
Figure 1. Plot of Cu levels in
liver and whole blood (all samples).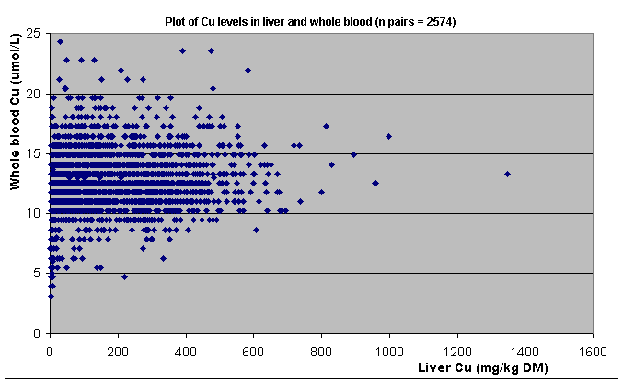
Figure 1a. Plot of Cu levels in
liver up to 50 mg/kg DM and those in blood. 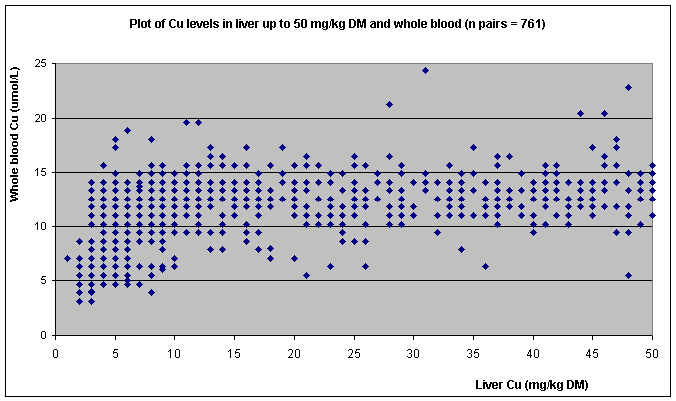
Figure 2. Relationships between
blood GPx and Se levels in kidney and liver.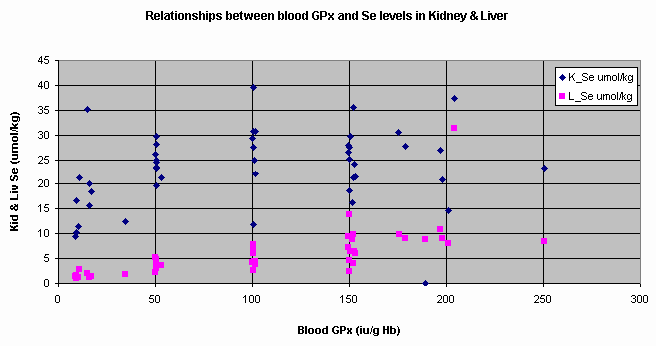
Figure 3. Relationships between Se
levels in kidney and liver.